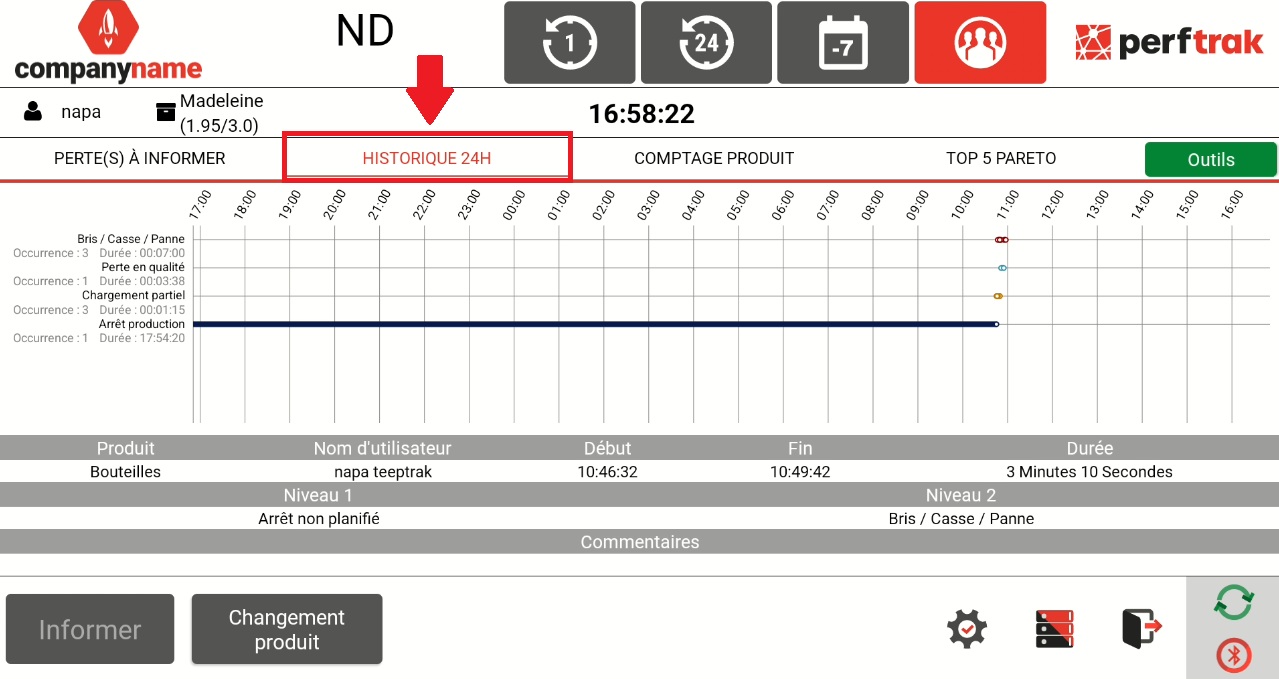
The 24H Chart tab on the tablet
The "24H Chart" tab displays all the losses recorded over the last 24 hours.
The losses are shown as a chronograph, which makes it easy to see the different stoppage occurrences over the period.
Viewing the details of a loss
Every recorded loss appears on the chronograph. Clicking one of them gives you the following information:
the product being produced at the time of the loss,
the user logged in when it was recorded,
the start time, the end time and the duration of the loss,
the level 1 and level 2 losses that were informed,
the operator's comment, if one was entered.