Path: PerfTrak > Efficiency History
Overview
The "Efficiency History" tab is the main tool for analysing the performance of your equipment. It lets you look at losses and performance from several complementary angles: efficiency history, losses Pareto, by operator, by machine, by product, by shift or by production order.
Filters
For each view, the following filters are available:
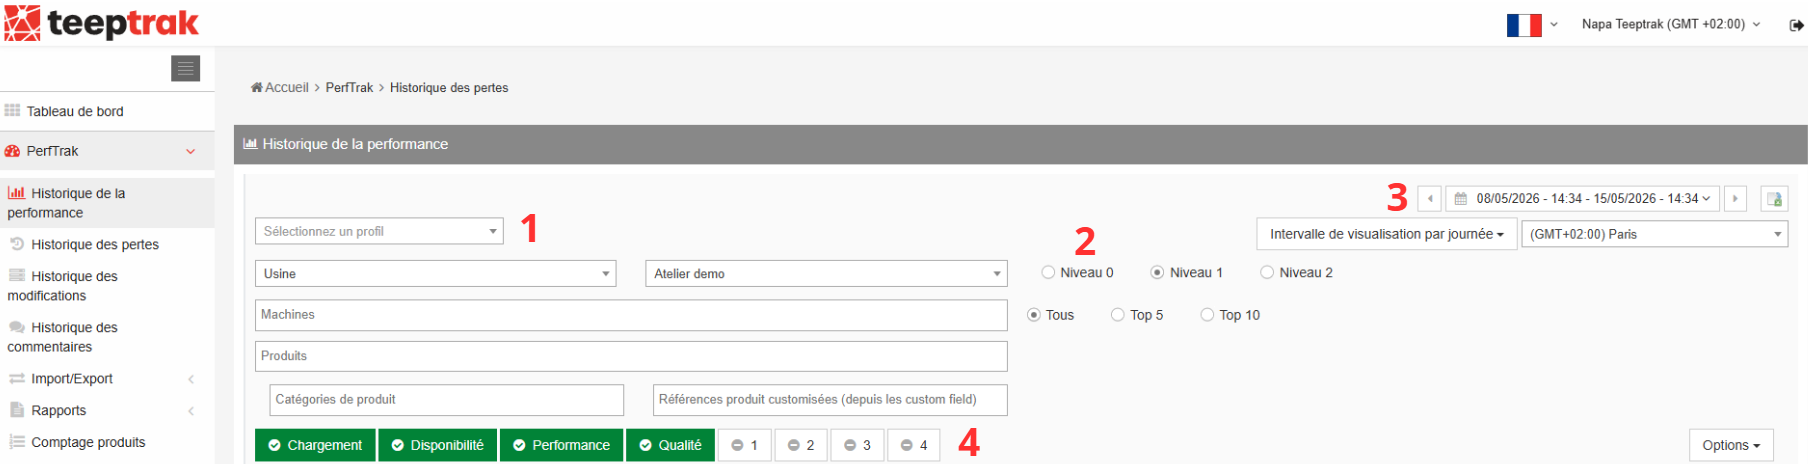
- Perimeter: select the factory, the workshop or the machine to analyse.
- Loss level: choose between Level 1 and Level 2 to refine the detail of the causes.
- Period: day, week, month or year.
The loss categories — loading, availability, performance, quality, custom — are automatically displayed and selected when the history is shown. You can deselect them by clicking on them, in order to isolate specific categories or stoppage causes (4).
Efficiency history
The home page of the history displays two histograms representing the performance of the machine. Placing the cursor on a bar shows the details of the corresponding period.
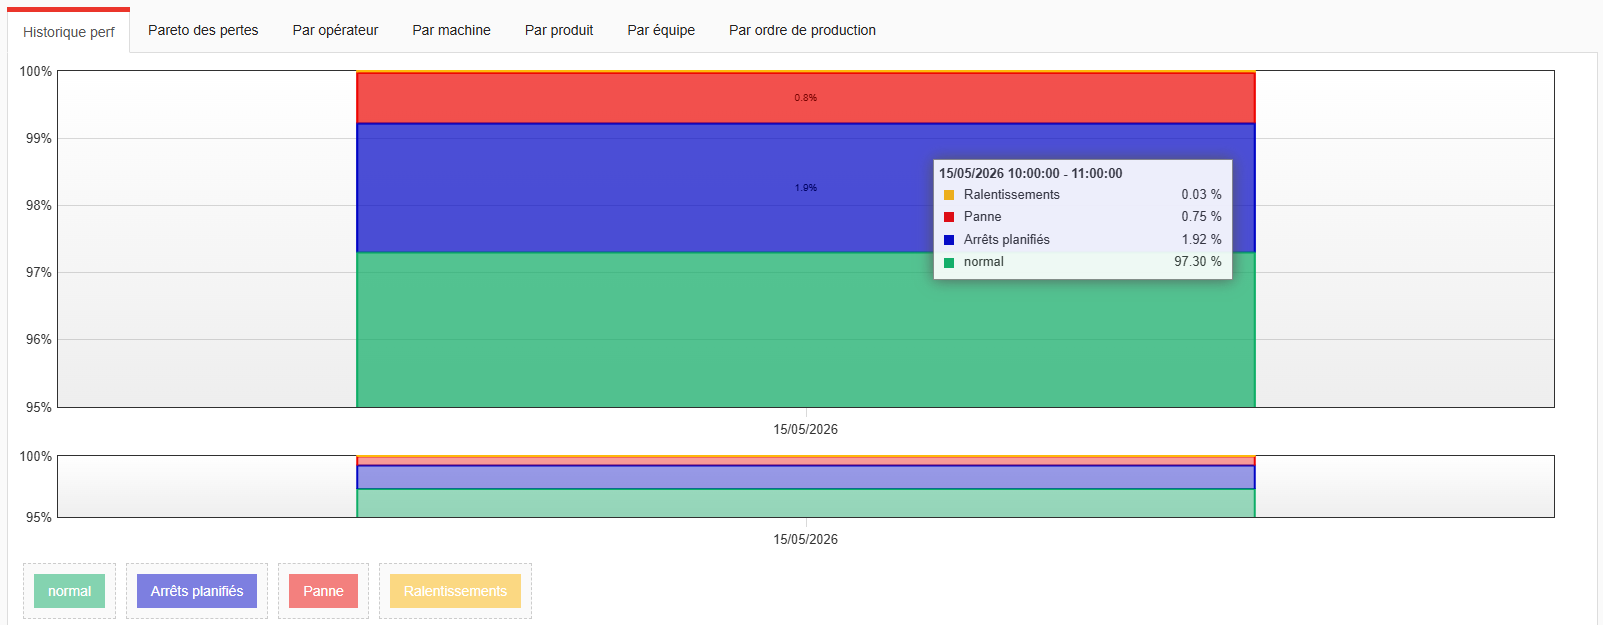
You can zoom in on a specific period using the mouse wheel, or by drawing a rectangle over the area you want to study.
Losses Pareto
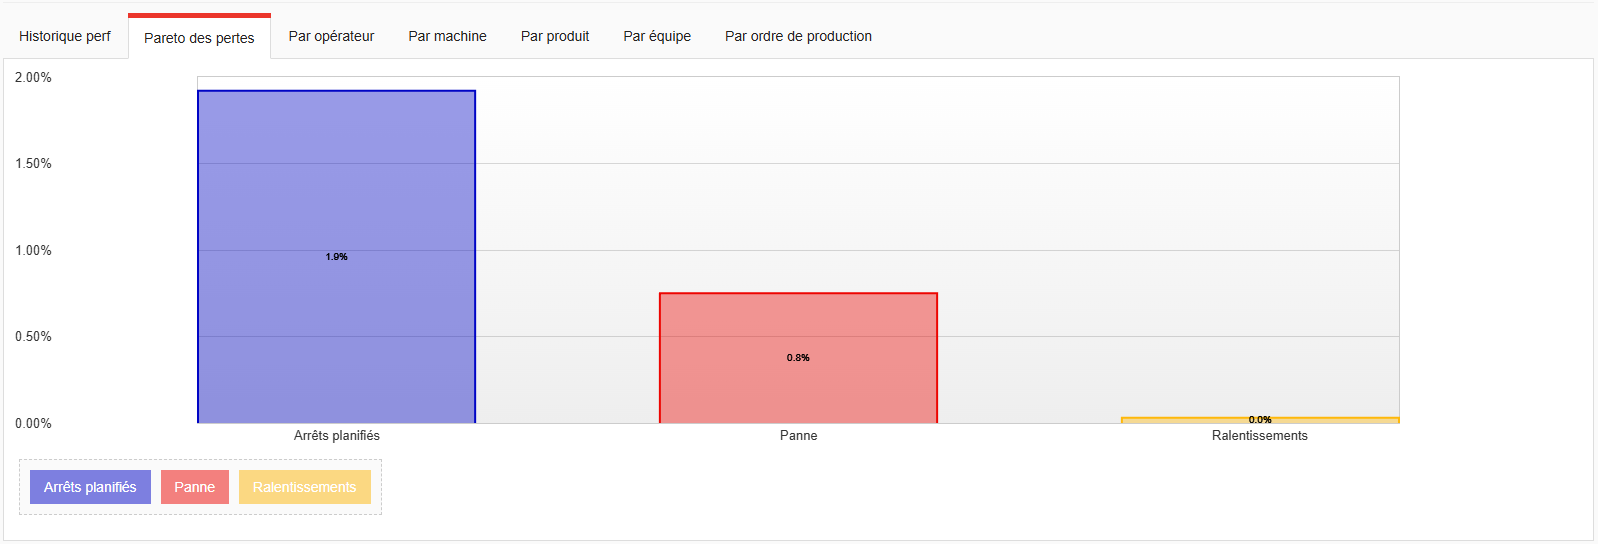
The Pareto chart is based on the principle that 20% of the problems generate 80% of the stoppages. This histogram makes it possible to visualise and quantify the main performance losses, and to measure the impact of the improvement actions that have been put in place.
By operator
This view shows the problems encountered by each team.
⚠️ In France, tracking individual operator performance is prohibited: an account must therefore be created per team, and not per individual operator. This view is useful to identify the difficulties specific to a team and to put corrective actions in place.
By machine, product, production order and shift
- By machine: gives an overview of your machine fleet. You can identify recurring problems, the state of your machines and their utilisation rate.
- By product: lets you identify which products are associated with recurring losses, qualify those losses and locate the source of the problem — internal or external — based on the configured loss tree. The more detailed the loss tree, the easier the identification of the causes.
Exporting the data
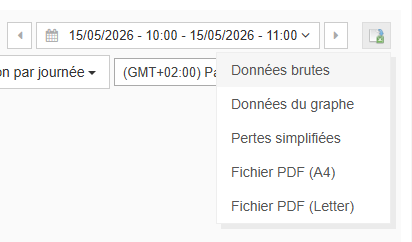
The export icon, next to the period selector, gives access to several download formats:
- Raw data
- Graph data
- A4 PDF file
- Letter PDF file