Introduction
The Machine Timeline KPI displays, in real time on your dashboard, a graphical representation of the operating time and of the losses that occurred on a PerfTrak machine over a defined interval. Two versions are available:
- Machine Timeline — Displays a timeline of the losses as coloured vertical bars on a time axis.
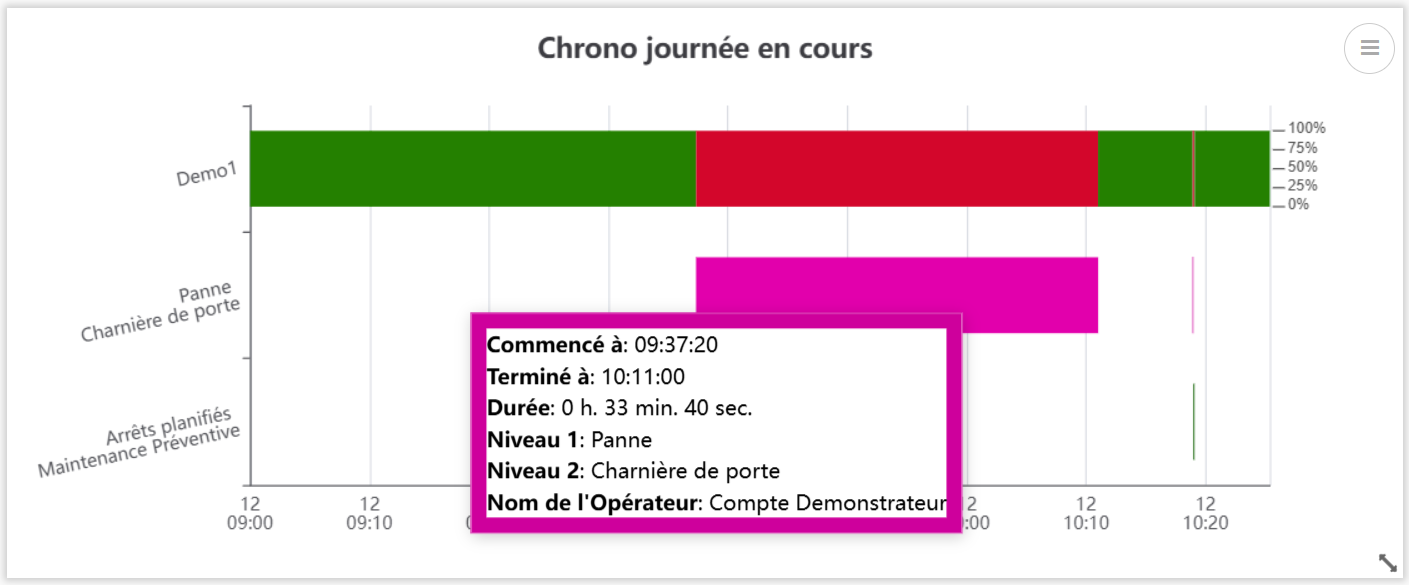
- Machine Timeline V2 — Overlays the machine's operating time (main bar) with one line per configured loss type, giving a more complete and detailed visual.
Example use cases
Overview of the stoppages during the shift — A team leader configures a timeline on the current shift to see at a glance how the stoppages since the beginning of the shift are distributed.
Analysing the main losses — A methods engineer uses the Machine Timeline V2 with loss level 2 and the top 5 to quickly identify the most frequent loss categories over the last 24 hours.
Filtering out micro-stoppages — A line manager configures the Machine Timeline with a minimum duration threshold (120 seconds, for instance) to hide micro-stoppages and focus on significant losses.
Spotting speed losses — A production manager enables the "Display speed losses on the production bars" option on the Machine Timeline V2, to see the proportion of speed loss and micro-stoppages directly on the operating bars.
Creating and configuring a Machine Timeline KPI
Step 1 — Create the KPI
Go to your dashboard.
Click Add New KPI, then select PERFTRAK machine as the machine type and Machine Timeline or Machine Timeline V2 as the KPI type.
Step 2 — General settings
| Field | Required | Description |
|---|---|---|
| Name | Yes | Free name for the KPI, displayed above the chart (e.g. "Timeline, current day") |
| Machine | Yes | A PerfTrak machine within your perimeter |
| Interval | Yes | Time window the timeline is displayed over |
💡 The "Current shift" interval can only be used after shifts have been created and assigned to the reference machine, in Setup > Shifts.
Step 3 — Select the loss groups
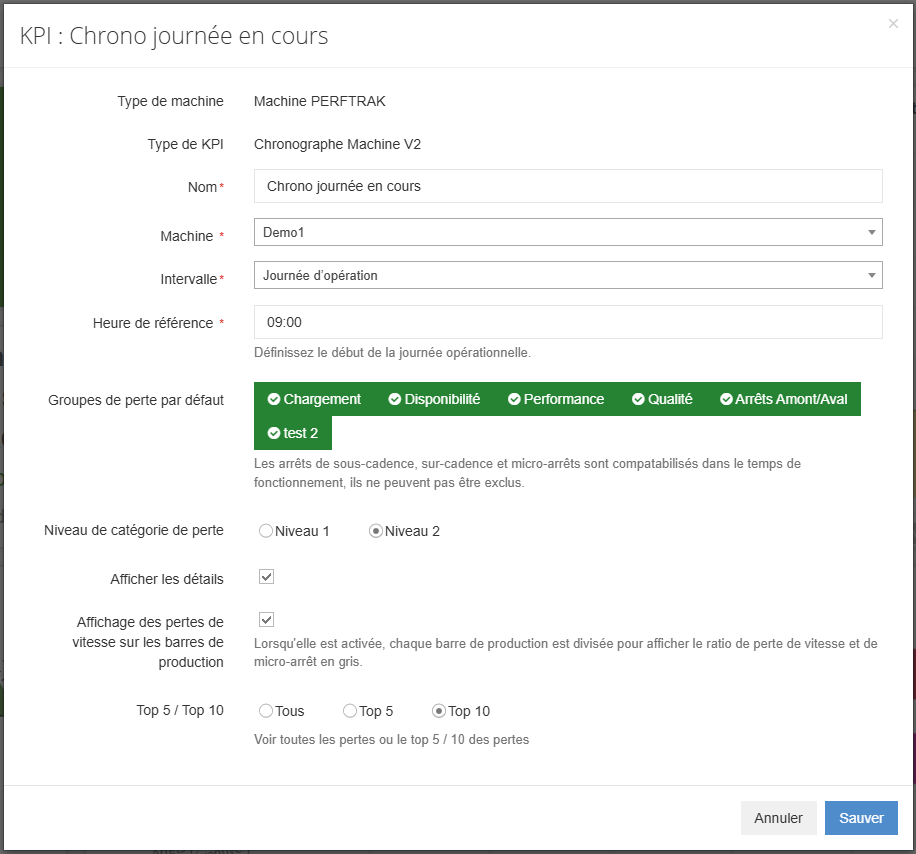
The default loss groups define which level 0 loss categories are taken into account in the display.
- The groups shown in green are included.
- The greyed-out groups are excluded.
Click a group to include or exclude it. Only the losses from the groups in green appear on the timeline.
⚠️ Machine Timeline V2 only — Speed loss, overclock and micro-stoppage events are counted within the operating time. They cannot be excluded.
Step 4 — Set the level and the display of the losses
| Option | Description |
|---|---|
| Loss category level | Choose the level of detail of the losses displayed: Level 1 or Level 2 |
| Top 5 / Top 10 / All | Limits the number of loss categories shown on the chart |
Step 5 — Options specific to each version
Machine Timeline:
| Option | Description |
|---|---|
| Display productive duration | Adds the total production time to the chart |
| Display only losses longer than | Filters out losses below a threshold, in seconds — useful to hide micro-stoppages |
Machine Timeline V2:
| Option | Description |
|---|---|
| Display details | Enables the detailed information shown when hovering over the bars |
| Display speed losses on the production bars | When enabled, each production bar is split to show the ratio of speed loss and micro-stoppage in grey |
Step 6 — Save
Click Save. The KPI appears immediately on your dashboard and updates in real time.
Reading the KPI
Machine Timeline
The chart shows a timeline on the horizontal time axis. Each loss appears as a vertical bar, coloured according to the loss category configured in the loss tree. A navigation bar at the bottom of the chart lets you zoom into part of the period.
Machine Timeline V2
The chart overlays several horizontal lines:
| Line | Description |
|---|---|
| Main line (machine name) | Operating bar in green, with the stoppages coloured according to their category |
| Lines per loss type | One line per configured loss category, showing each occurrence on the time axis |
Hovering over an operating bar (the green bar) displays a tooltip with:
- Started at (start time)
- Ended at (end time)
- Duration
- Speed loss (duration of the speed losses and micro-stoppages included in this operating period)
- Operator name
If the "Display speed losses on the production bars" option is enabled, each green bar is visually split: the grey part represents the ratio of speed loss and micro-stoppage over that operating period.
Edge cases and points to watch
Machine outside your perimeter. Only the PerfTrak machines included in your perimeter are offered for selection. If a machine is missing, contact your administrator to check your access rights.
No data over the selected interval. If the machine has not sent any data over the period, the timeline shows an empty chart. Check that the interval is suitable and that the machine is connected.
Speed loss, overclock and micro-stoppages (V2). These events are no longer displayed as separate loss lines in the Machine Timeline V2. They are included in the operating time (green bar). The detail is available by hovering over the bar, and the ratio can be made visible by enabling the "Display speed losses on the production bars" option.
Minimum duration threshold (V1 only). The "Display only losses longer than" filter applies to the display only. The filtered losses are not removed from the data; they are simply hidden on the chart.
Number of categories displayed. With the "All" option, every loss category of the chosen level is displayed. On machines with many categories, prefer "Top 5" or "Top 10" for better readability.
Deleting a dashboard. Deleting an account (manager or administrator) deletes the dashboards associated with it, including the KPIs they contain.
FAQ
What is the difference between the Machine Timeline and the Machine Timeline V2? The Machine Timeline displays losses as vertical bars on a time axis. The Machine Timeline V2 overlays an operating bar and one line per loss type, giving a more complete view. The V2 also includes speed losses and micro-stoppages within the operating time, with the option of showing their ratio in grey on the production bars.
Can I create several timelines for the same machine? Yes. You can for instance create a Machine Timeline V2 on the current shift in top 5, and a Machine Timeline over the last 24 hours with a minimum duration filter.
Does the KPI show history? The KPI displays the data over the selected interval. It does not keep history beyond that window.
Can I share this KPI with other users? The KPI is visible on the dashboard. Any user who has the machine in their perimeter and access to the dashboard will be able to see it.
How often is it updated? The KPI refreshes automatically, in real time, with the data sent by the machine.
Can the loss colours be customised? The loss colours match those configured in your project's loss tree. They cannot be set at KPI level.