The V2 performance indicators allow you to configure different performance indicators by selecting the levels 0, 1 and 2 within your loss tree. This tool goes beyond the classic configuration, which uses only level 0 losses: it allows you to filter and isolate specific downtimes related to sub-causes in higher-level losses (levels 1 and 2).
You can thus include loss times from all three levels — 0, 1 and 2 — within the numerator and the denominator of your indicators. The indicator is then displayed on your dashboards with flexible interval options.
Accessing the configuration
First go to the PerfTrak tab of your configuration and monitoring platform, then select the Loss Configurations tab.
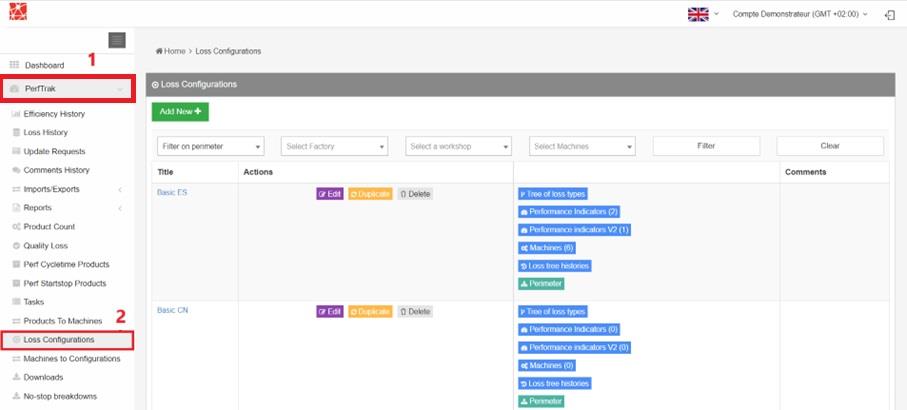
From your displayed loss trees, select the one on which you want to configure your indicator. Indicators can then be "linked" to the machines associated with this particular loss tree.
Next, click Performance indicators V2, or go to the Edit tab and select the tab of the same name.
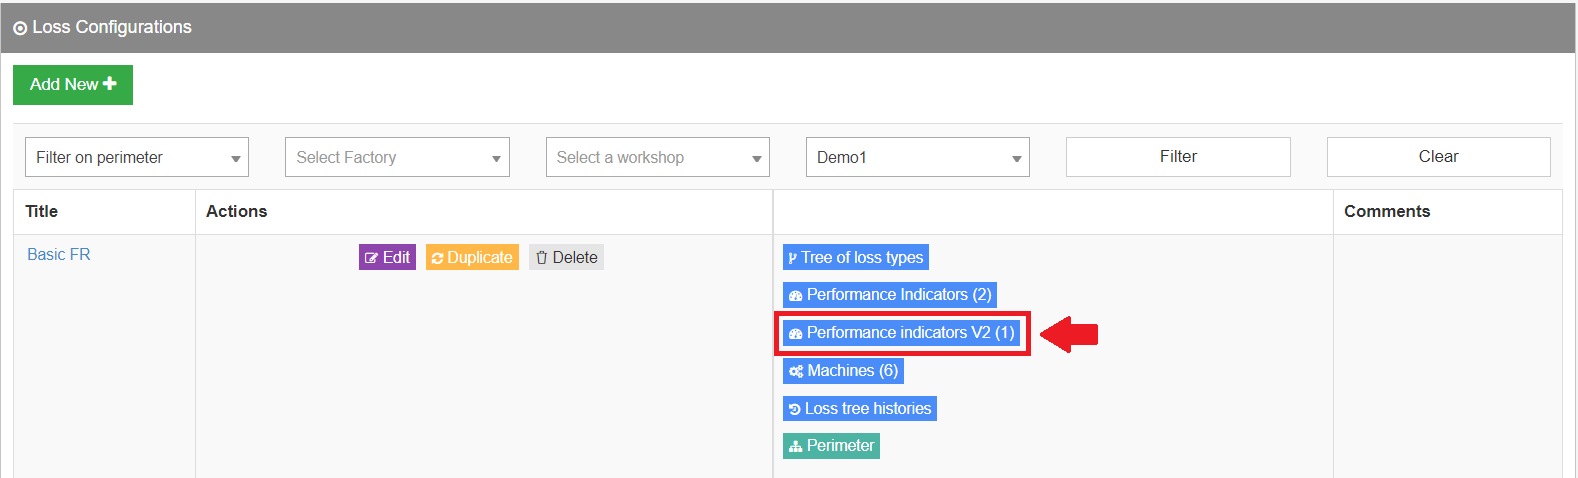
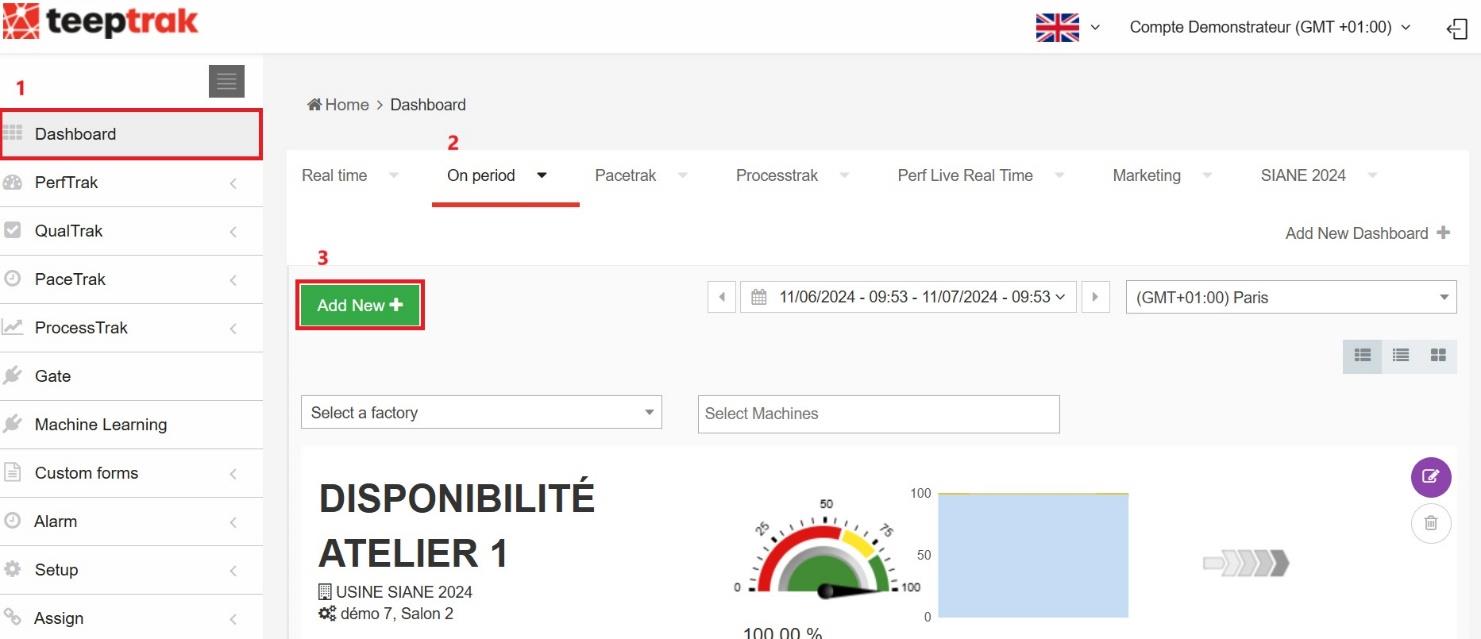
Then click Add New+ to start configuring your indicator.
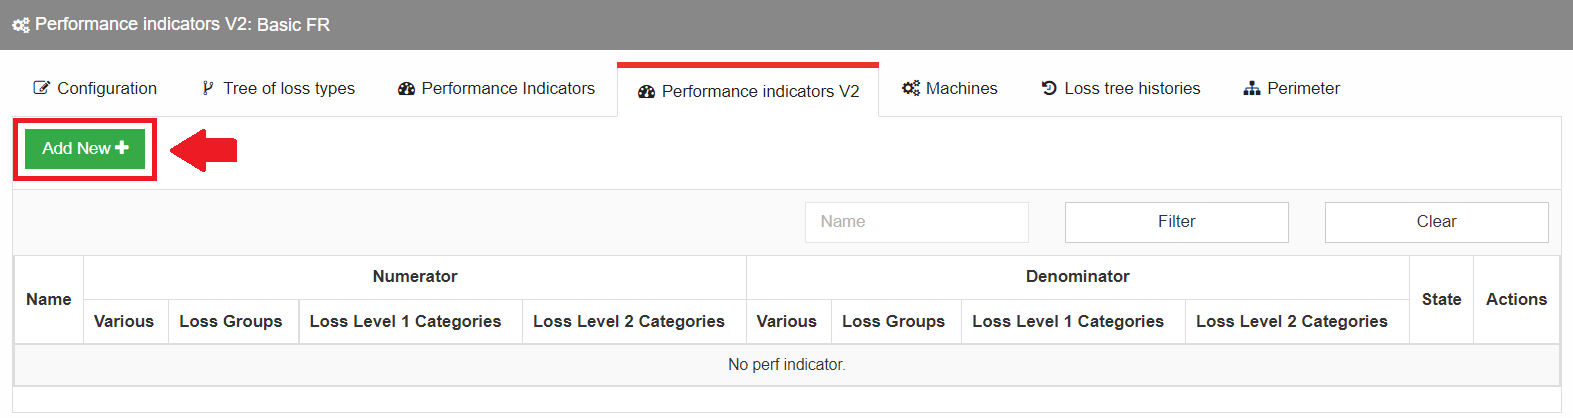
The configuration of the indicator consists of three distinct parts:
- the name and the determination of the different criticality thresholds of the indicator,
- the choice of the losses to associate with the numerator,
- the choice of the losses to associate with the denominator.
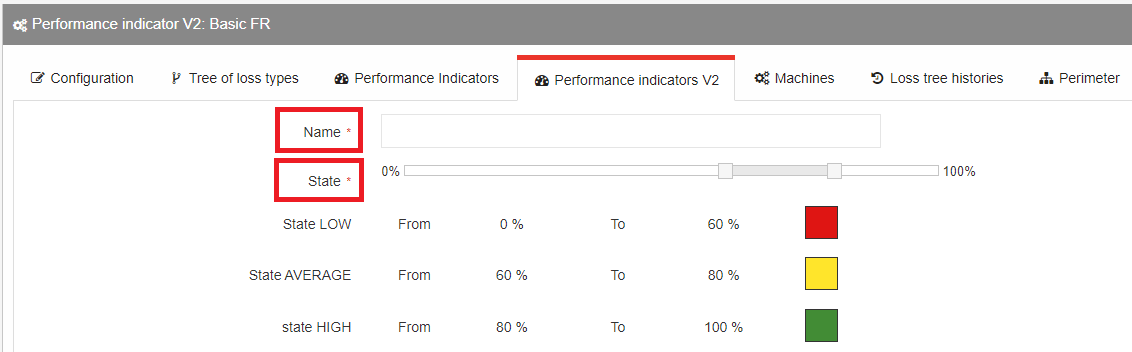
1. Criticality thresholds of the indicator
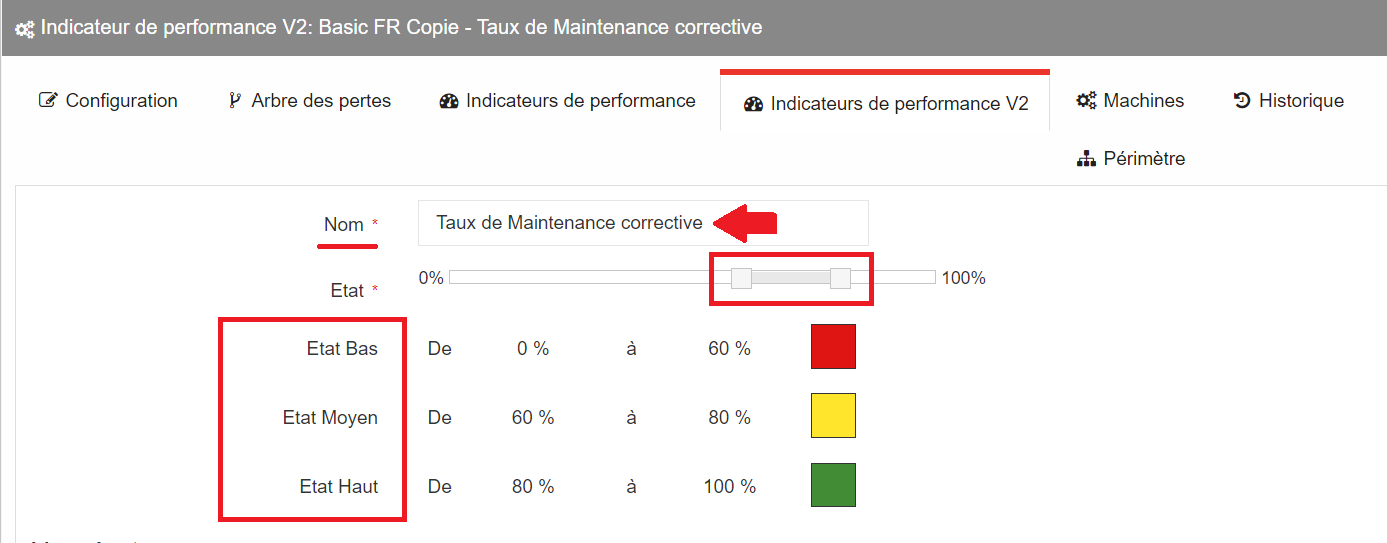
Give a name to your indicator and define the different criticality thresholds of the recorded levels, with their colour codes. You can use the horizontal gauge to adjust the criticality levels.
In this example, we have designated that:
- anything below 60 % is considered bad (Low state),
- any level between 60 % and 80 % is considered average or acceptable (Average state),
- anything above 80 % is considered high (High state).
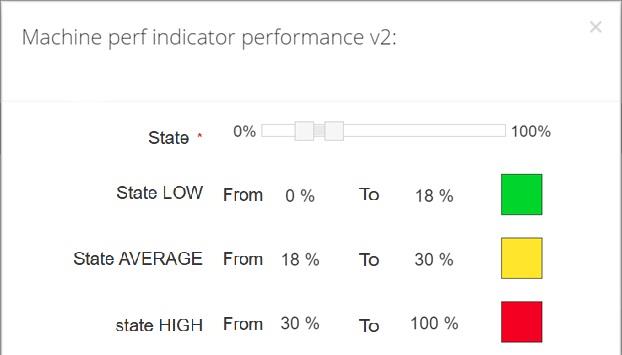
However, not all configurable ratios follow the same logic, where high thresholds are considered good and low ones bad.
Typically, if losses are included in the numerator, the qualification logic is reversed. For example:
- any level below 18 % is considered good (Low state),
- levels between 18 % and 30 % are considered medium or acceptable (Average state),
- any level above 30 % is considered poor (High state).
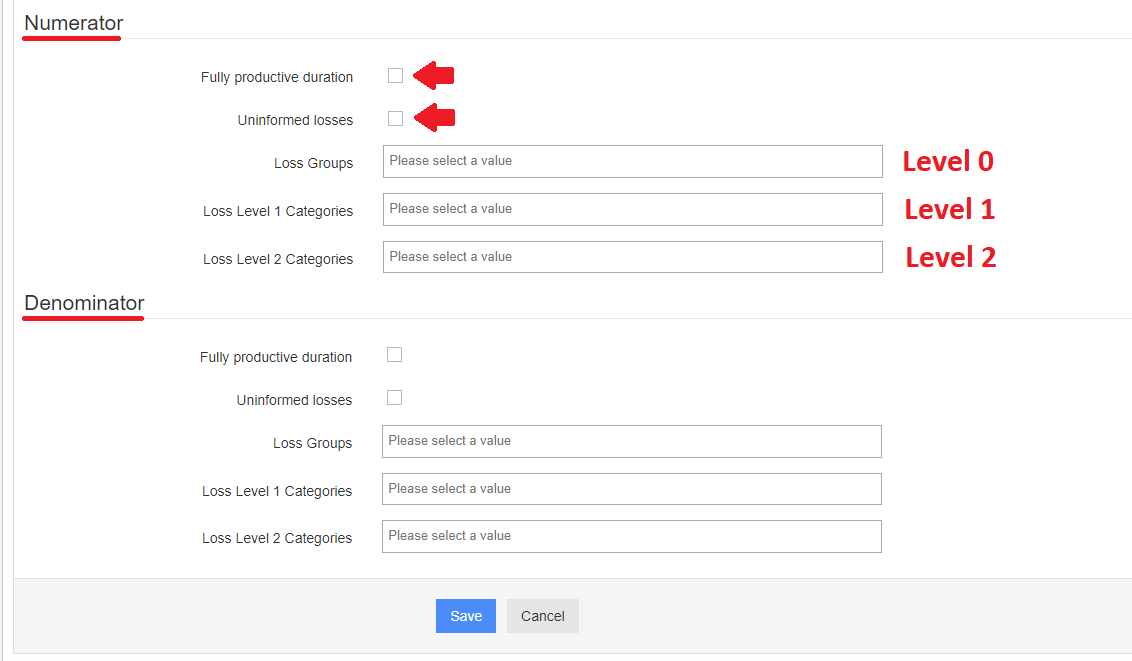
2. Numerator configuration
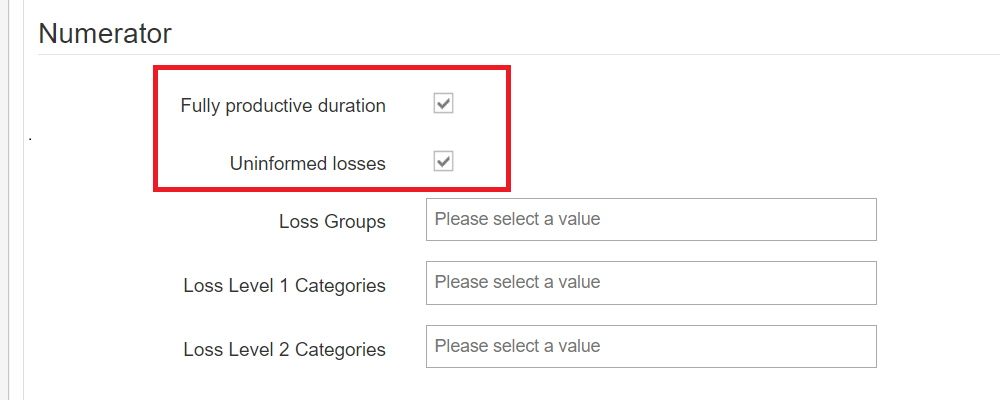
a. Fully productive duration
First of all, you are given the choice of whether or not to add the Fully productive duration and the Uninformed losses, by checking or unchecking these two options.
b. Loss Groups
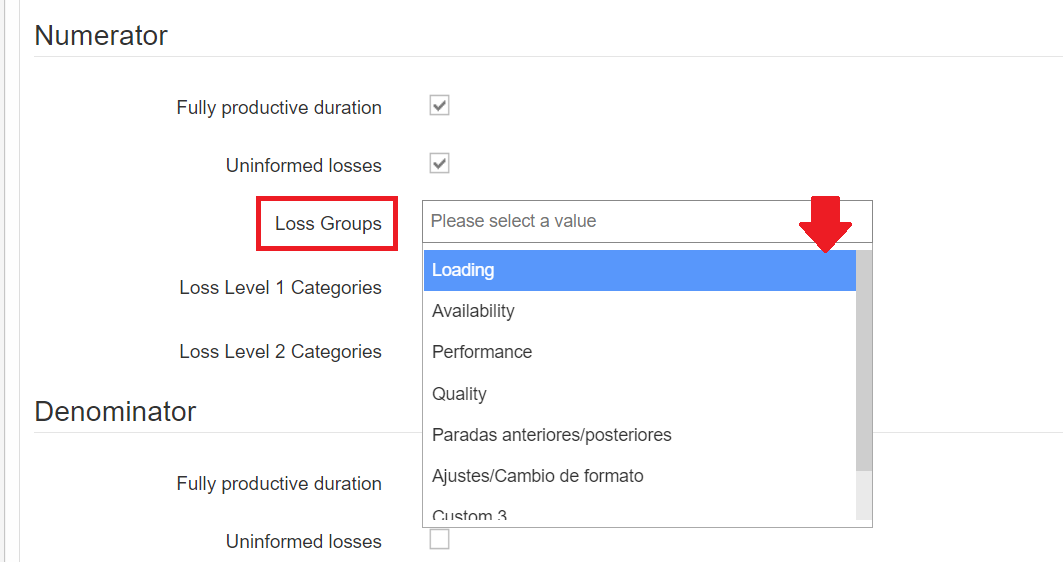
This section corresponds to the selection of the level 0 losses, which represent your broadest categories. If you follow the AFNOR standards framework, these typically include the Loading, Availability, Performance and Quality losses.
If you choose these types of losses, you will automatically include all of the level 1 and level 2 loss subcategories belonging to the level 0 category selected.
c. Loss Level 1 Categories
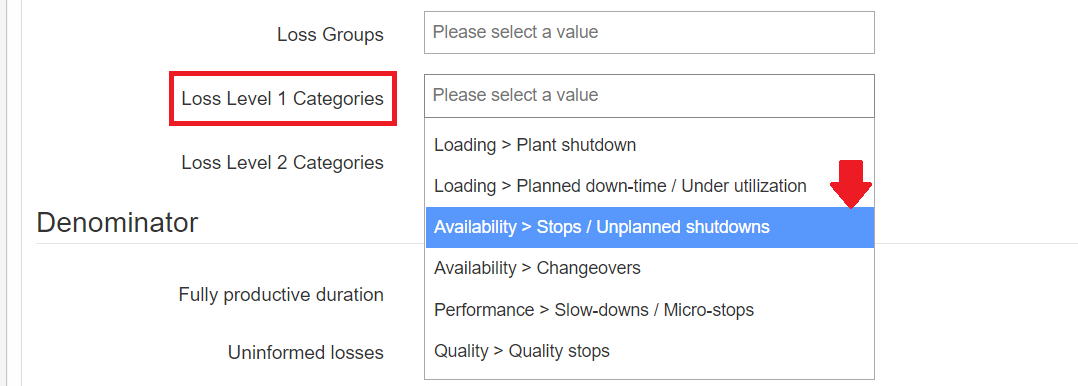
This section allows you to select the losses associated with level 1 of your loss tree. If you choose these types of losses, you will automatically include all the level 2 loss subcategories belonging to the level 1 category selected.
d. Loss Level 2 Categories
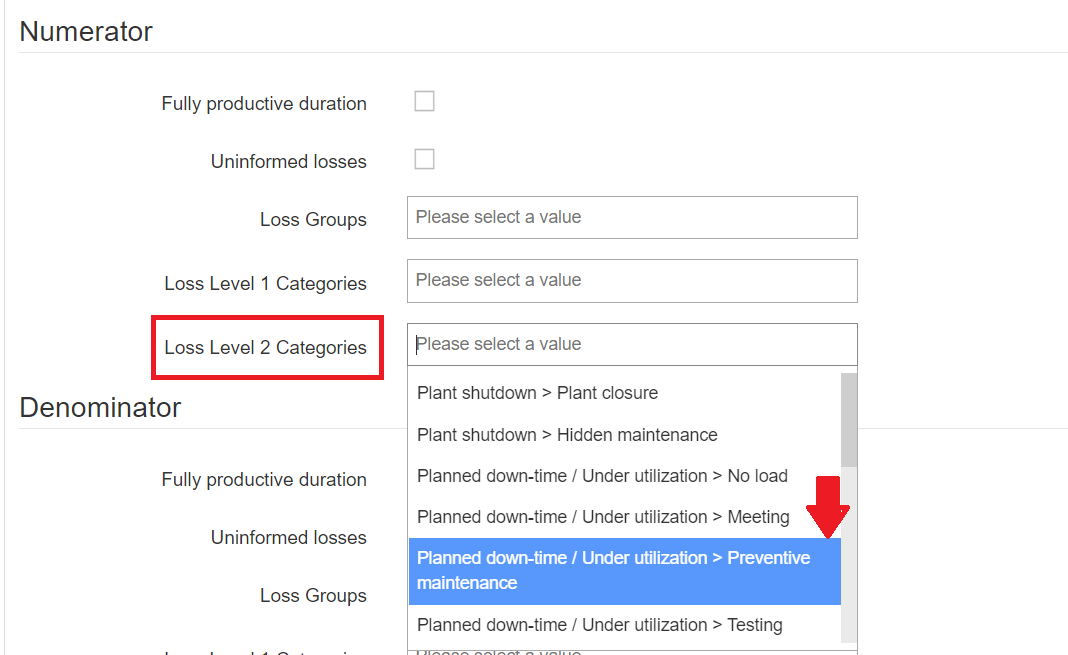
This section allows you to select the losses associated with level 2 of your loss tree.
3. Denominator configuration
The logic is the same for selecting the type and the level of the losses to associate with the denominator of your indicator. Just like when configuring the levels of losses for the numerator, you will be able to choose, with precision, the level 0, 1 or 2 losses to include or exclude, alongside the Fully productive duration and the Uninformed losses.
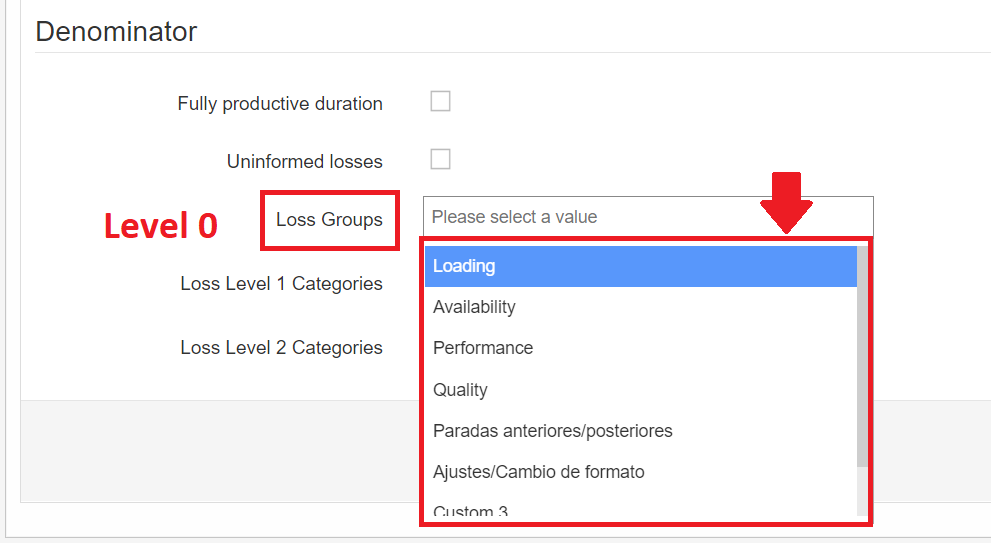
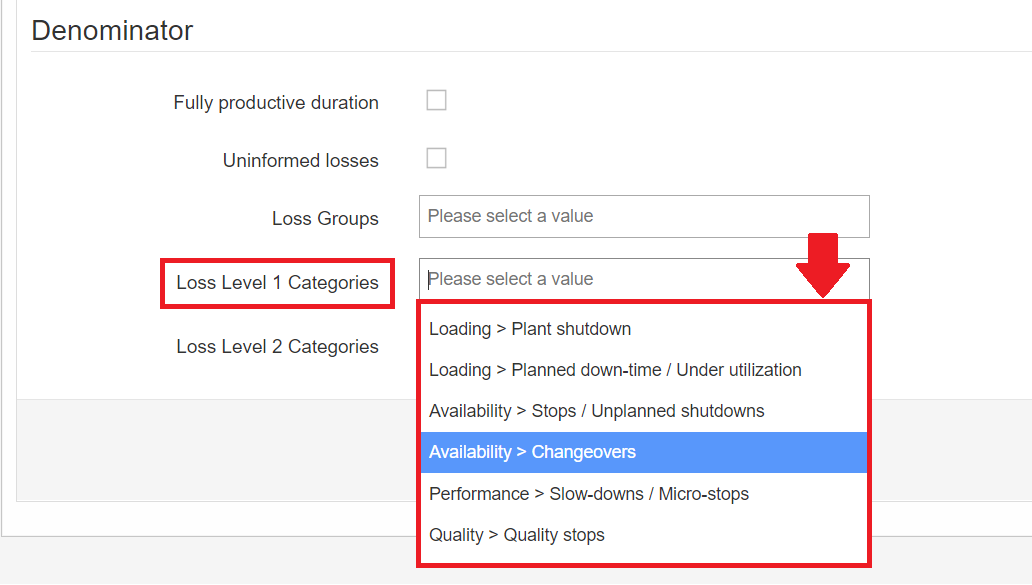
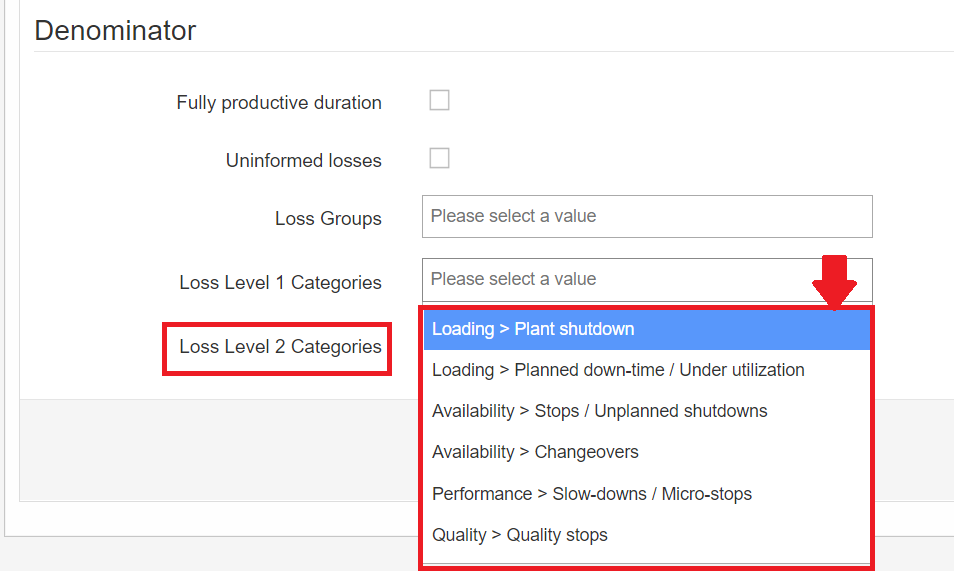
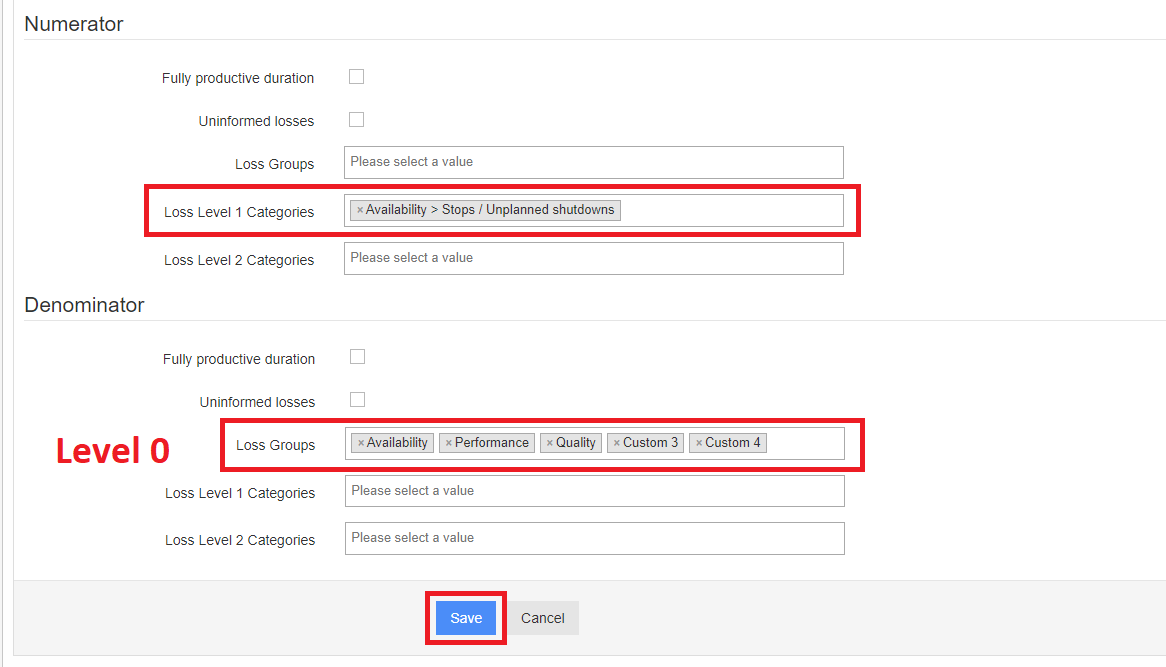
In the example below, the boxed sections represent the losses associated with the numerator and the denominator of the indicator: a level 1 loss for the numerator, and several level 0 losses for the denominator.
Once the indicator is configured, save your creation.
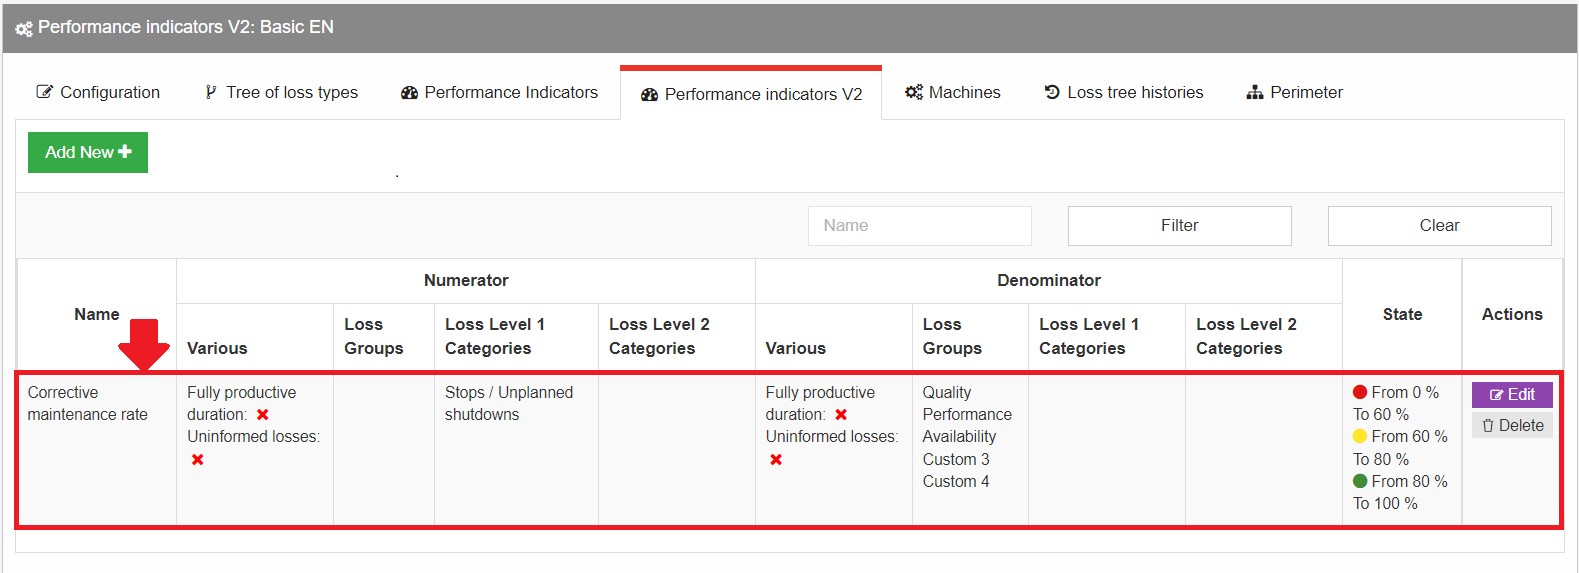
Your indicator then appears at the top of the page with its title, the losses displayed in the numerator and the denominator, along with the details of each level 0, 1 and 2, as well as its criticality levels.
Defining the perimeter of the indicator
Next, you need to define the perimeter to which the indicator will be applied. This perimeter is directly linked to the perimeter of the loss tree on which it has been configured (factories, workshops, machines, etc.).
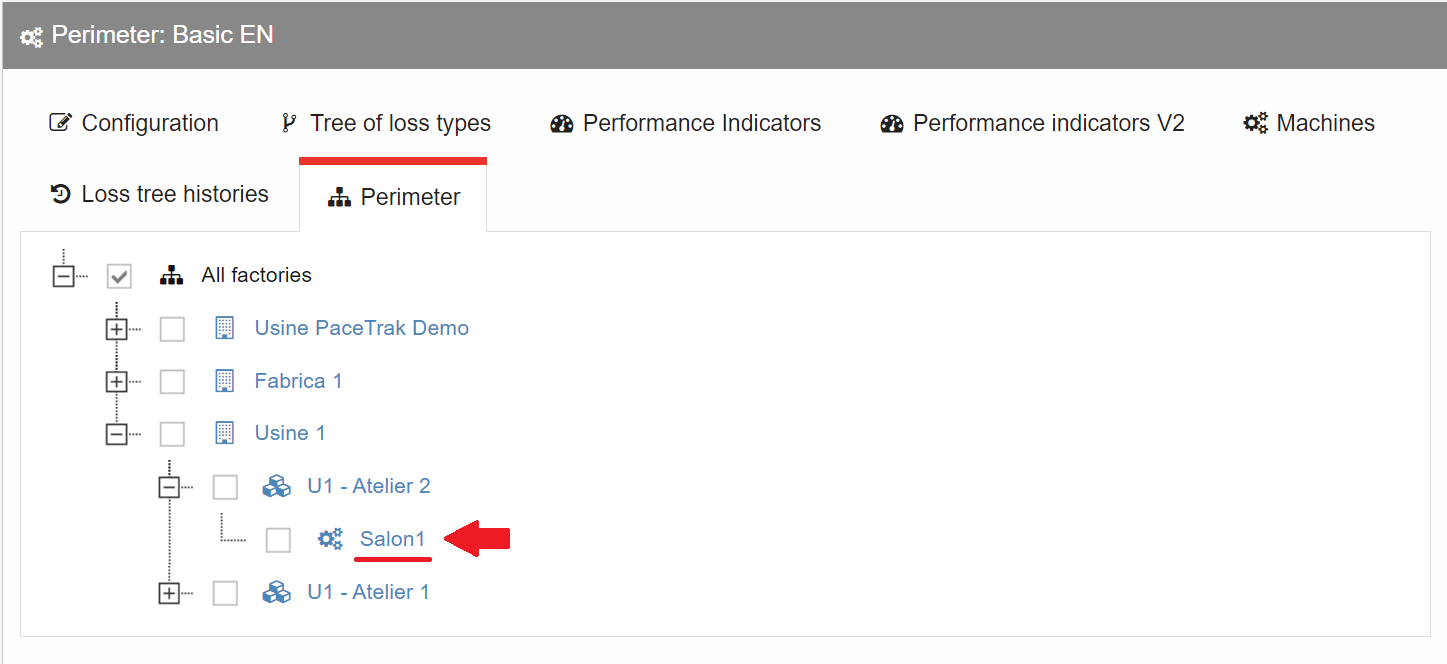
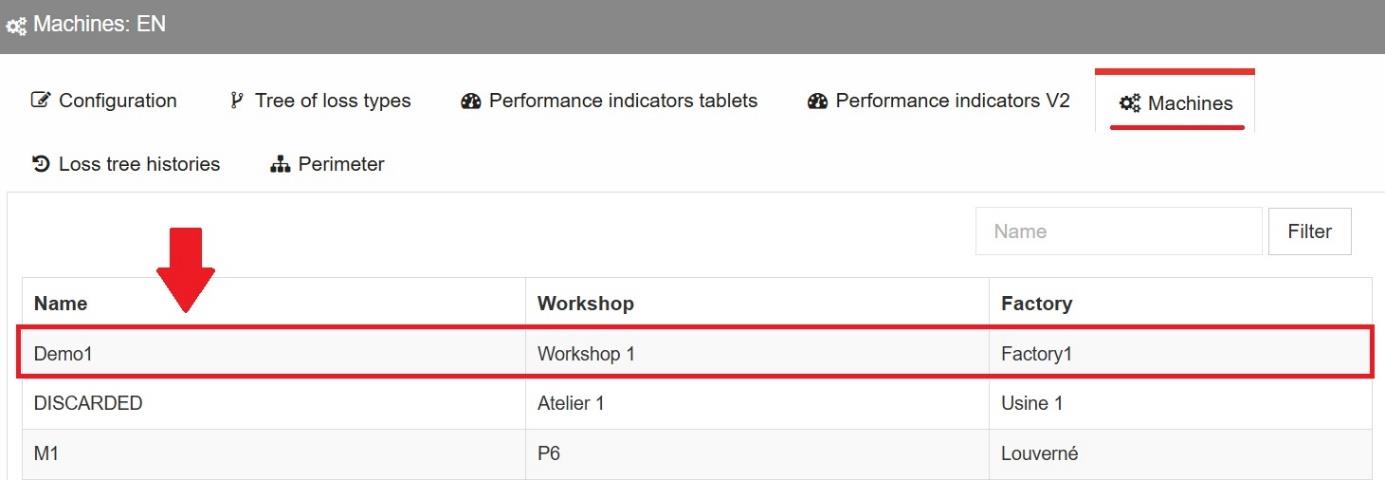
The Machines tab of your loss tree specifies exactly which machines your loss tree — and indirectly the indicator — is associated with.
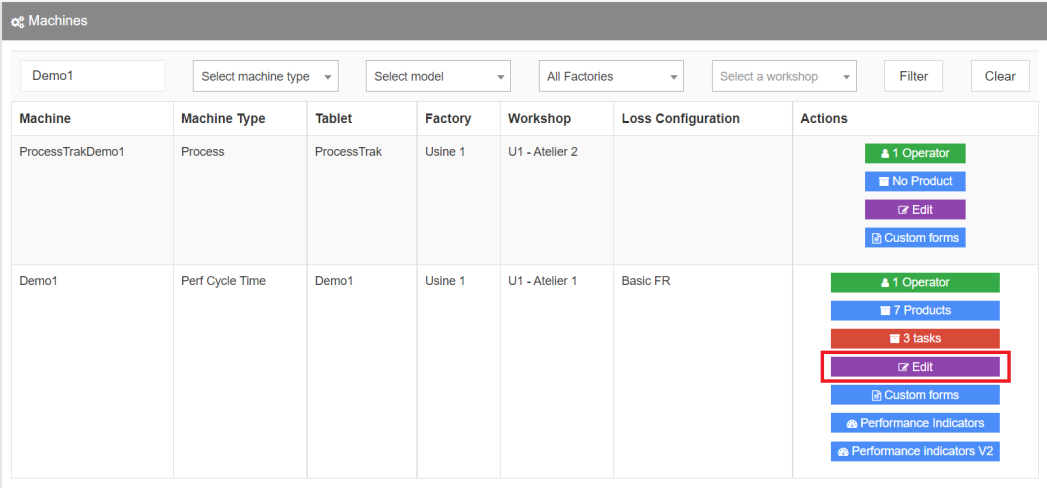
To confirm the correct association between your machine and its indicator, you can also go to the Licenses & Machines tab, then Machines, and click Edit.
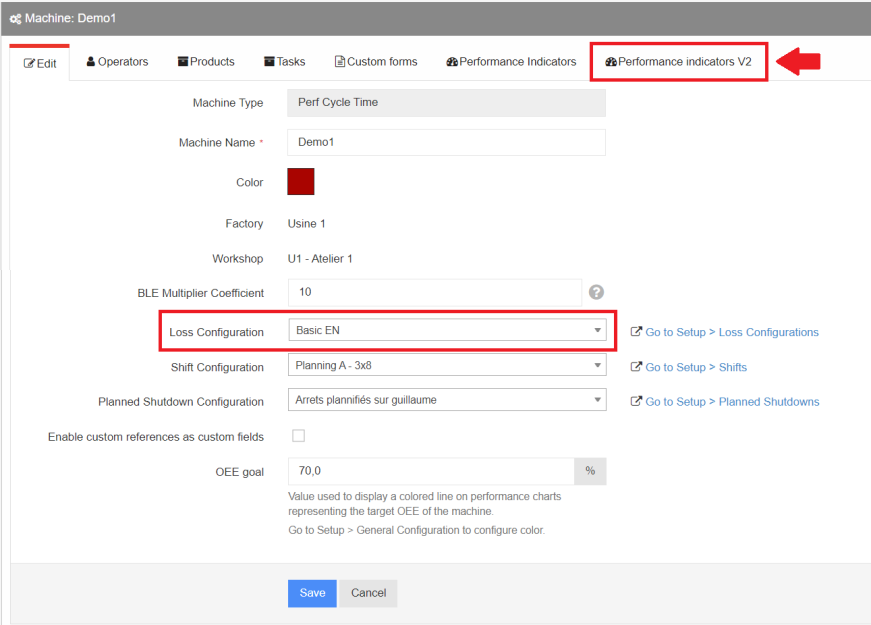
Then select the Performance indicators V2 tab and check which loss tree has been associated with your machine.
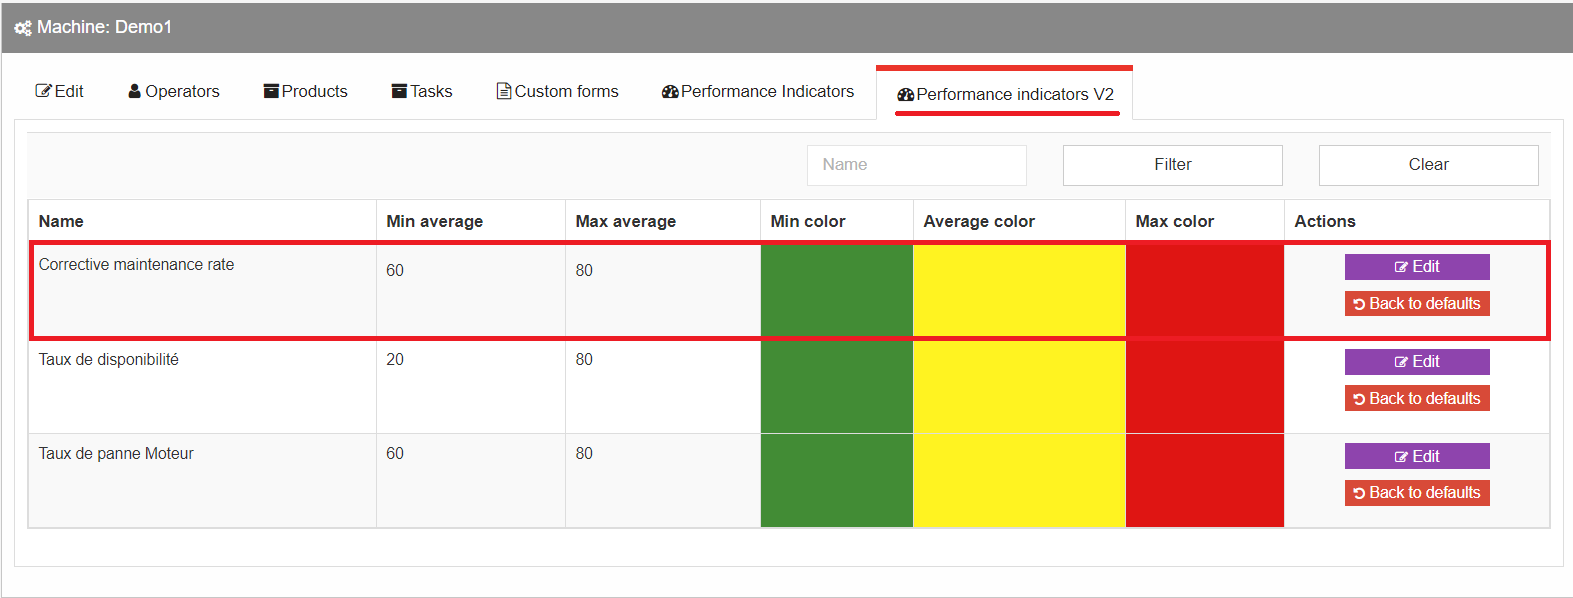
Displaying the indicator on a dashboard
Once configured on the platform, the indicator is displayed on the tablet associated with its reference machine.
It is also possible to display the indicator on your dashboards at flexible intervals. Since the indicator has already been configured, all you need to do is select the name of your V2 indicator from your list of configurations.
On your configuration platform, go to the Dashboard tab, then On period, and click Add New to add a new periodic indicator.
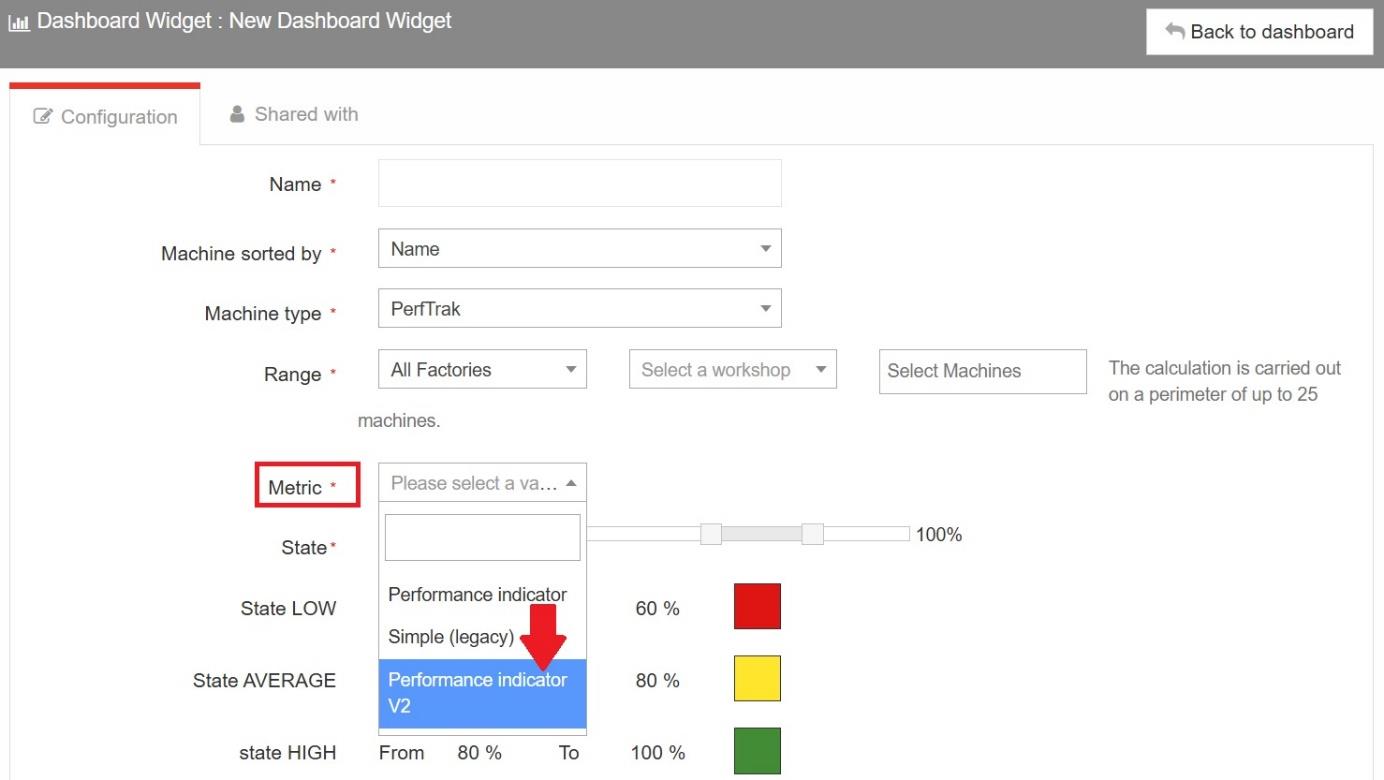
Among the available options, the Metric field allows you to select the type of indicator to add. Choose Performance indicator V2.
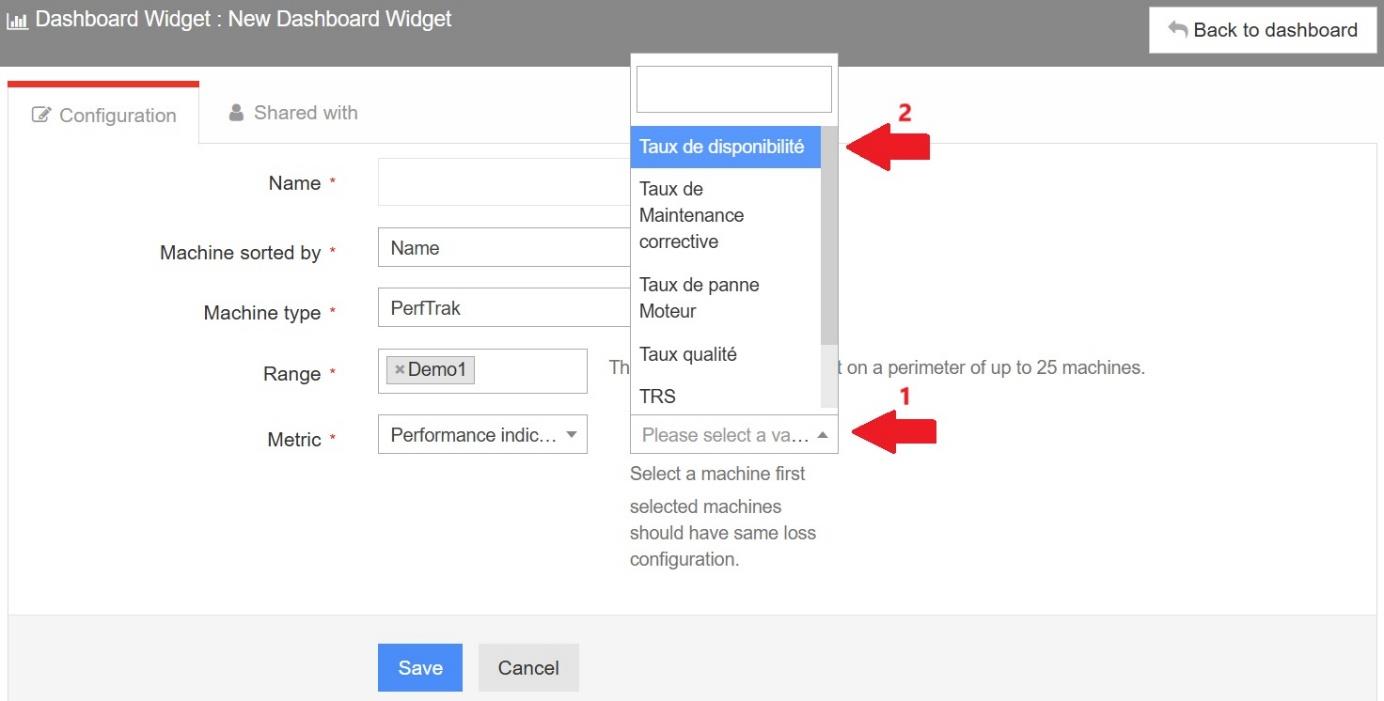
Once the metric is selected, you have access to the indicators you have previously created. In this example, we choose to display the availability rate.

You can display the measurement of the tracked indicator over specific periods, using the tool in the upper right corner of the screen.
