Introduction
The Comment KPI displays, in real time on your dashboard, the comment attached to the most recent loss of a given PERFTRAK machine. It lets managers immediately see what the shop floor reports — a breakdown, a drift, an anomaly — without having to check the Loss History or the Comments History regularly.
Only the comments attached to losses are displayed: comments from quality sessions are not concerned.
Example use cases
Real-time monitoring of a line — A manager follows several machines from their dashboard. Thanks to the Comment KPI, the latest operator comment on each of them appears immediately, with no extra navigation.
Reacting quickly to incidents — An operator qualifies a stoppage as "Breakdown > Motor" and adds a comment describing the problem. The manager sees it in real time on their dashboard and can call maintenance without delay.
Following shop floor communication — A workshop manager adds a Comment KPI next to the Machine Status KPI, to cross-check the current status and the latest operator report at a glance.
Creating and configuring a Comment KPI
Step 1 — Create the KPI
Go to your dashboard.
Click Add New KPI, select PERFTRAK Machine as the machine type, then Last comment as the KPI type.
Step 2 — Configure the KPI
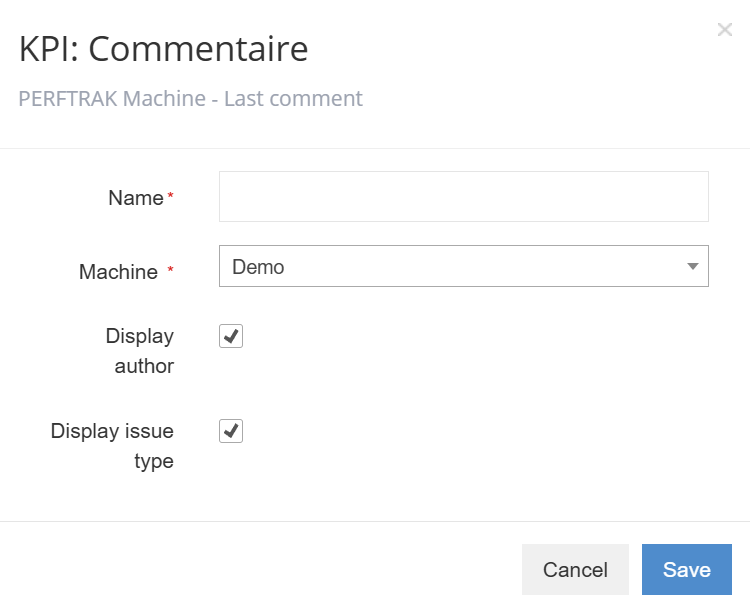
Fill in the following fields:
- Name (required) — the name of your indicator, as it will appear on the dashboard.
- Machine (required) — the PERFTRAK machine whose comments you want to follow.
- Display author — tick this option to display the name of the operator account attached to the loss.
- Display issue type — tick this option to display the loss type attached to the comment, with its hierarchy (for example Breakdown > Motor), as well as the duration of the loss.
Click Save.
Reading the KPI
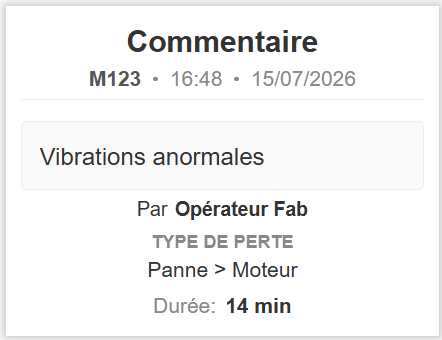
The KPI displays:
- The header — the machine name, the time and the date of the latest comment.
- The comment text — as entered by the operator.
- The operator — the operator account attached to the stoppage, if the option is enabled.
- The loss type — the qualified cause of the attached loss, with its hierarchy, if the option is enabled.
- The duration — the duration of the loss concerned.
The icon at the bottom right enlarges the KPI.
The KPI updates automatically: it always shows the comment attached to the most recent loss of the machine. As soon as a comment is entered on a new loss, it replaces the one displayed.
Edge cases and points to watch
- Only one comment is displayed — The KPI shows only the latest comment. To see everything that has been reported, use the Comments History.
- Quality session comments — They are never displayed by this KPI; only comments attached to losses are taken into account.
- Editing an older comment — The KPI displays the comment of the most recent loss. If an operator edits the comment of an older loss, that change does not appear in the KPI.
- One machine per KPI — The KPI is configured for a single machine. To follow several machines, create one Comment KPI per machine.
FAQ
Can I display the comments of several machines in a single KPI? No, each Comment KPI is attached to a single machine. Add as many Comment KPIs as there are machines to follow on your dashboard.
Why does a comment entered during a quality session not appear? The Comment KPI only displays comments attached to losses. Quality session comments remain available in their dedicated views.
Is the displayed comment updated in real time? Yes. As soon as a new comment attached to a loss is entered on the machine, it replaces the one displayed.
What happens if the operator edits a comment? The KPI displays the comment attached to the most recent loss. Editing the comment of an older loss therefore does not change what the KPI shows.