Introduction
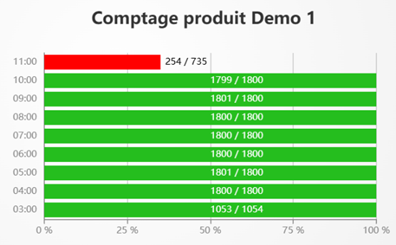
The Product Count on Last Hours KPI displays, in real time on your dashboard, the number of pieces produced by a PerfTrak machine hour by hour, as horizontal bars. Each bar represents one hour and compares the number of pieces produced with a target calculated from a target value, expressed as a percentage. The colour of the bar — green or red — instantly shows whether the target has been met.
💡 This KPI aggregates all the pieces produced, across all products. If several product references were manufactured over the period, no distinction is made: the count is global.
Example use cases
Hourly production tracking on a workshop screen — A team leader displays the KPI on a large screen to follow, hour by hour, whether the production rhythm matches the target. A red bar at 2 pm immediately signals a drop to investigate.
Comparing output between peak and off-peak hours — A production manager configures the KPI over the last 8 hours to identify the time slots where productivity falls and adjust resources accordingly.
Visual alert on shift performance — A quality manager sets a demanding target value (90%, for instance) and watches for red bars to trigger corrective actions in real time.
Follow-up after a batch change — A methods engineer looks at the KPI after a batch change to check that the nominal pace is reached from the first hour of production.
Creating and configuring a Product Count on Last Hours KPI
Step 1 — Create the KPI
Go to your dashboard.
Click Add New KPI, then select PERFTRAK machine as the machine type and Product Count on Last Hours as the KPI type.
Step 2 — General settings
| Field | Required | Description |
|---|---|---|
| Name | Yes | Free name for the KPI, displayed above the chart (e.g. "Count H-8") |
| Machine | Yes | A PerfTrak machine within your perimeter |
| Interval | Yes | Time window the count is displayed over, hour by hour |
⚠️ The interval cannot exceed 24 hours.
Step 3 — Set the target value
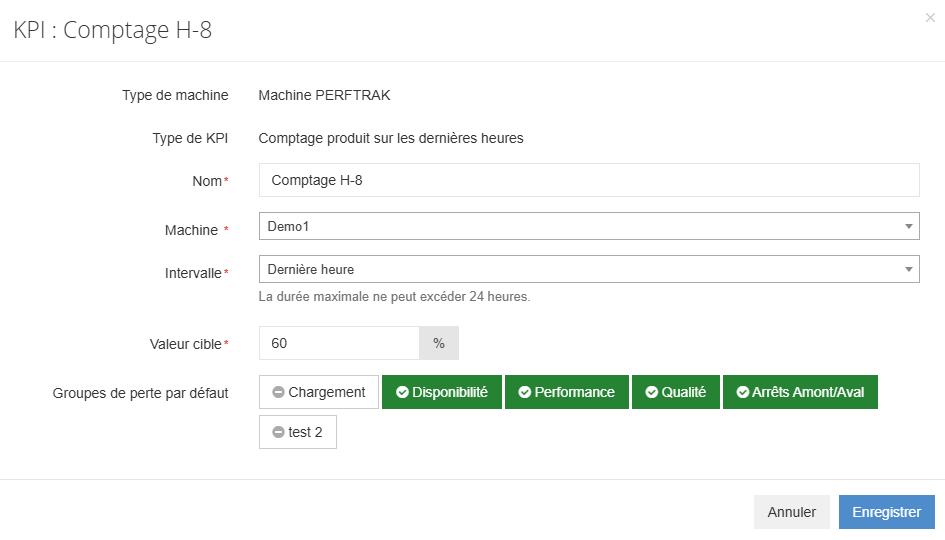
The Target value field, in percent, defines the production target for each hour. This target is calculated from the theoretical pace of the current product.
- If production reaches or exceeds the target value, the bar is displayed in green.
- If production is below the target value, the bar is displayed in red.
Step 4 — Select the loss groups
The default loss groups define which loss categories are taken into account when calculating the target.
- The groups shown in green are included in the calculation.
- The greyed-out groups are excluded.
Click a group to include or exclude it. For example, excluding the "Loading" group keeps loading times out of the production target calculation.
Step 5 — Save
Click Save. The KPI appears immediately on your dashboard and updates in real time.
Reading the KPI
The KPI is displayed as a horizontal bar chart:
| Element | Description |
|---|---|
| Vertical axis | Hours of the period (e.g. 17:00, 18:00) |
| Horizontal axis | Percentage from 0% to 100% of the target |
| Bar | Progress of the actual production against the target |
| Value on the bar | Displayed as pieces produced / target (e.g. "7218 / 7236") |
| Green colour | The target is reached or exceeded |
| Red colour | The target is not reached |
Edge cases and points to watch
Aggregation across all products. This KPI does not distinguish between product references. If several products were manufactured within the same hour, their counts are added together. For per-product tracking, use the "Product Count" KPI.
Machine outside your perimeter. Only the PerfTrak machines included in your perimeter are offered for selection. If a machine is missing, contact your administrator to check your access rights.
Interval limited to 24 hours. The maximum interval is 24 hours. For longer periods, use the "Product Count" KPI with an extended interval (7 days, 31 days, and so on).
No data for an hour. If no piece was produced during a given hour — machine stopped, break — the corresponding bar shows 0 pieces.
Target value at 0%. If the target value is set to 0%, every bar appears green whatever the production. Set a realistic target value, consistent with your theoretical pace.
Deleting a dashboard. Deleting an account (manager or administrator) deletes the dashboards associated with it, including the KPIs they contain.
FAQ
Can I create several Product Count on Last Hours KPIs for the same machine? Yes. You can for instance create one KPI over the last hour with a 90% target and another over the last 8 hours with a 60% target.
Does the KPI show history? The KPI shows the hour-by-hour detail over the selected window, up to 24 hours. It does not keep history beyond that window.
Can I share this KPI with other users? The KPI is visible on the dashboard. Any user who has the machine in their perimeter and access to the dashboard will be able to see it.
How often is it updated? The KPI refreshes automatically, in real time, with the data sent by the machine.
What is the difference with the "Product Count" KPI? The "Product Count" KPI displays a total count per product reference, as a table. The "Product Count on Last Hours" KPI displays a global count, across all products, hour by hour, as bars with a visual green/red target.