Introduction
The Current Product KPI displays, in real time on your dashboard, the production pace of a PerfTrak machine calculated over a sliding interval. This interval can be defined by a duration (in seconds) or by a number of pulses received by the module. You choose the display unit — pieces per minute, pieces per hour, minutes per piece or seconds per piece — and the number of decimals, and can additionally display the theoretical pace, the current production order, the batch, the custom reference, the product category and the logged-in user.
Example use cases
Real-time pace monitoring for the operator — An operator displays the KPI on the tablet at the workstation and checks at a glance that the actual pace matches the theoretical pace of the product being made.
Detecting a pace drift — A team leader enables the display of the theoretical pace to visually compare the actual pace with the target. A significant gap signals a machine problem or a setting to adjust.
Tracking by production order — A planner enables the "Display OF" option to immediately identify which production order is running and at what pace it is being produced.
Pace smoothed over the last pulses — A methods engineer configures the "Quantity" mode with a value of 100, to calculate the average pace over the last 100 pulses received and smooth out one-off variations.
Average of the last cycle times — On a machine with a long cycle time, a production manager configures the "Quantity" mode with a value of 4 and the "seconds / piece" unit to display the average of the last 3 cycle times.
Creating and configuring a Current Product KPI
Step 1 — Create the KPI
Go to your dashboard.
Click Add New KPI, then select PERFTRAK machine as the machine type and Current Product as the KPI type.
Step 2 — General settings
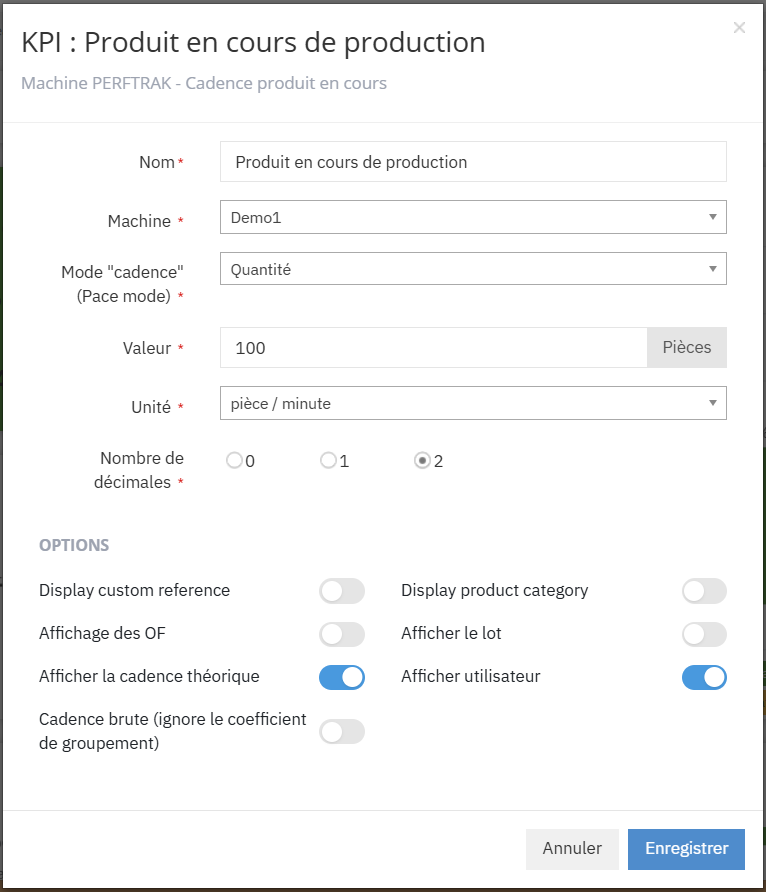
All the fields below are required.
| Field | Description |
|---|---|
| Name | Free name for the KPI, displayed on the visual (e.g. "Pace – Press 12") |
| Machine | A PerfTrak machine within your perimeter |
| Pace mode | Duration or Quantity: defines the sliding interval the pace is calculated over (see step 3) |
| Value | Size of the interval. Its meaning depends on the pace mode chosen (see step 3) |
| Unit | Unit the pace is displayed in (see step 4) |
| Number of decimals | Number of decimals displayed for the pace: 0, 1 or 2 |
Step 3 — Configure the pace calculation mode
The "Pace mode" determines the sliding interval the calculation is performed over. The Value field does not mean the same thing in each mode:
| Mode | Meaning of the Value field |
|---|---|
| Duration | Time window, in seconds (from 1 to 3,600), over which the pace is calculated. |
| Quantity | Number of pulses: the pace is calculated over the last N pulses received by the module. |
"Duration" mode
The system only looks at the defined time window. With Value = 1, for example, only the last second is taken into account. If no pulse is detected during this window, the calculated pace is 0.
⚠️ Choose a window that covers several theoretical cycle times. For example, for a product with a theoretical time of 100 seconds per piece, a window of a few seconds will almost always display a pace of 0: prefer a window of 300 to 600 seconds. For long cycle times, the "Quantity" mode is generally a better fit.
"Quantity" mode
The observed period is no longer defined in time, but by the last N pulses received by the module:
- at least 2 pulses are needed for the system to calculate the time elapsed between them, which is the cycle time of the last piece;
- beyond that, the pace displayed is an average over the intervals between these pulses: N pulses make N − 1 intervals.
| Value | Pulses observed | Result displayed |
|---|---|---|
| 2 | 2 | Cycle time of the last piece |
| 4 | 4 | Average of the last 3 cycle times |
| 11 | 11 | Average of the last 10 cycle times |
⚠️ In "Quantity" mode, the value entered is a number of pulses, not of pieces. If a grouping coefficient is set on the machine, one pulse can stand for several pieces. The "Raw pace" option (see step 5) lets you ignore this coefficient if needed.
Step 4 — Choose the display unit
Select the unit the pace will be displayed in:
| Unit | Description |
|---|---|
| piece / minute | Number of pieces produced per minute |
| piece / hour | Number of pieces produced per hour |
| minute / piece | Time in minutes to produce one piece |
| second / piece | Time in seconds to produce one piece |
On the visual, the "piece" label is replaced by the unit of the current product when one is defined (e.g. "Litre / minute").
Then choose the number of decimals (0, 1 or 2) to display.
Step 5 — Choose the options
Seven options are available as toggles:
| Option | Description |
|---|---|
| Display custom reference | Displays the custom reference of the current product |
| Display product category | Displays the category of the current product |
| Display OF | Displays the name of the current production order on the KPI |
| Display batch | Displays the batch number attached to the current production |
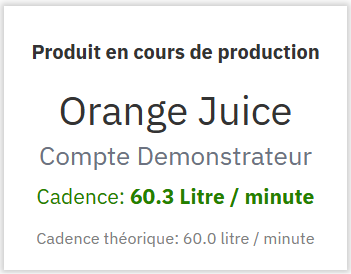
| Display theoretical pace | Displays the theoretical pace of the current product, below the actual pace |
| Display user | Displays the name of the user account logged in to the machine |
| Raw pace (ignores the grouping coefficient) | Calculates the pace without applying the grouping coefficient set on the machine |
Step 6 — Save
Click Save. The KPI appears immediately on your dashboard and updates in real time.
Reading the KPI
The KPI displays the following information, depending on the options enabled:
| Line | Description |
|---|---|
| KPI name | Title defined during the configuration |
| Product | Name of the product currently being manufactured |
| User | Account logged in to the machine (if the option is enabled) |
| Actual pace | Value calculated in real time, displayed in green in the chosen unit |
| Theoretical pace | Target pace of the product, displayed in grey (if the option is enabled) |
Edge cases and points to watch
Machine outside your perimeter. Only the PerfTrak machines included in your perimeter are offered for selection. If a machine is missing, contact your administrator to check your access rights.
Pace displayed as 0 in Duration mode. If no pulse is detected during the defined time window, the calculated pace is 0. This happens when the machine is stopped, but also when the window is shorter than the cycle time of the product. Increase the value to cover several theoretical cycle times, or switch to "Quantity" mode.
Fewer than 2 pulses in Quantity mode. The system needs at least 2 pulses to calculate an interval. A value of 1 does not allow a pace to be calculated.
Grouping coefficient and Quantity mode. In "Quantity" mode, the value entered is a number of pulses, not of pieces. If a grouping coefficient is configured (1 pulse = N pieces), adjust the value accordingly or enable the "Raw pace" option to ignore this coefficient.
Theoretical pace not displayed. The theoretical pace is only available if a pace target has been defined on the current product. If no target is set, the line stays empty even when the option is enabled.
Production orders not configured. If you enable "Display OF" without having configured production orders beforehand, the KPI cannot display any production order information.
Deleting a dashboard. Deleting an account (manager or administrator) deletes the dashboards associated with it, including the KPIs they contain.
FAQ
Can I create several Current Product KPIs for the same machine? Yes. You can for instance create one KPI in pieces per minute over a 60-second interval and another in pieces per hour over the last 100 pulses, for the same machine.
Does the KPI show history? No. The Current Product KPI is a real-time visual. It displays the pace calculated over the current sliding interval.
Can I share this KPI with other users? The KPI is visible on the dashboard. Any user who has the machine in their perimeter and access to the dashboard will be able to see it.
How often is it updated? The KPI refreshes automatically, in real time, with the data sent by the machine.
What is the difference between the Duration and Quantity modes? The "Duration" mode calculates the pace over a fixed time window (for example the last 60 seconds). The "Quantity" mode calculates it over a fixed number of pulses (for example the last 100 pulses). The Quantity mode is more stable when the pace varies a lot or when the cycle time is long, because it adapts to the actual production rhythm.
Why does my KPI permanently display a pace of 0? In "Duration" mode, this means no pulse was detected during the observed window. If the machine is producing, the window is too short compared with the cycle time: increase the value to cover several theoretical cycle times, or use the "Quantity" mode.
Can I display an average over the last pieces? Yes. Use the "Quantity" mode: the pace displayed is the average of the intervals between the last N pulses. To get the average of the last 3 cycle times, enter Value = 4 (4 pulses = 3 intervals).
What is the "Raw pace" option for? When a grouping coefficient is set on the machine, one pulse can stand for several pieces. The "Raw pace" option lets you ignore this coefficient in the pace calculation.