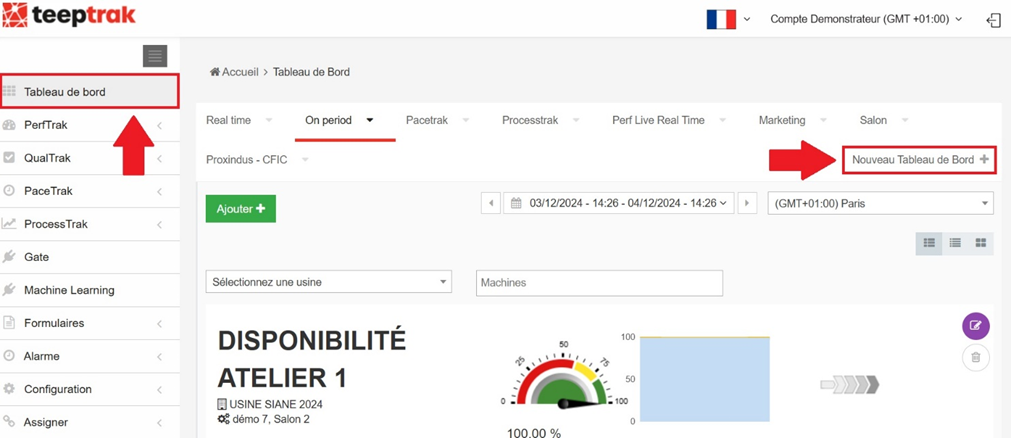
Log in to your teeptrak.net interface by entering your username and password. Once logged in, click the Dashboard tab.
To create a new dashboard in your account, click the Add New Dashboard + button on the right.
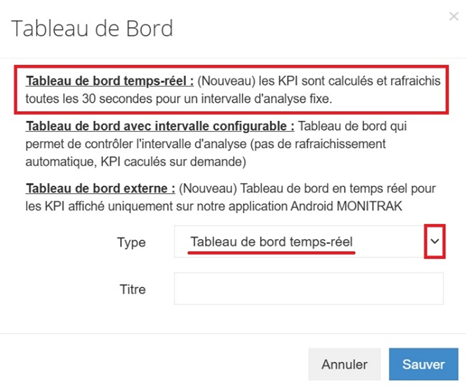
A window opens, offering three types of dashboard:
- Real Time Dashboard: the KPIs are calculated and refreshed every 30 seconds, over a fixed analysis interval.
- Flexible Interval Dashboard: a dashboard that lets you control the analysis interval. There is no automatic refresh; the KPIs are calculated on demand.
- External Dashboard: a real-time dashboard displayed only in the MONITRAK Android application.
In the Type section, select "Real Time Dashboard" and enter a name.
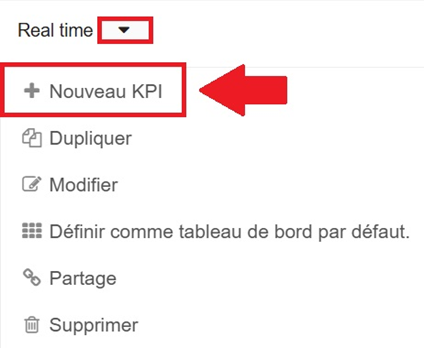
To add a KPI to your dashboard, click the arrow to the right of the dashboard title and select Add New KPI. A pop-up window opens:
- select the type of machine the KPI will be configured for,
- select the KPI type you want,
- click Next,
- configure the KPI by filling in the form that appears:
- enter the KPI title, which is displayed on the dashboard above the KPI,
- select the machine,
- select the time interval the KPI is calculated over,
- fill in the fields specific to that KPI,
- click Save.
The KPI appears at the bottom of the dashboard. Its calculation may take a few moments: the KPI frame is then greyed out and displays "waiting for data".
You can move the KPI frame around the dashboard: hover over its top right corner, the cursor turns into a small hand, then click and drag the KPI where you want it. You can also resize the KPI frame: hover over its bottom right corner, the cursor turns into a double arrow, then click and resize.
Important: deleting an account (manager or administrator) also deletes the dashboards associated with it. Make sure you take this into account before proceeding.