Introduction
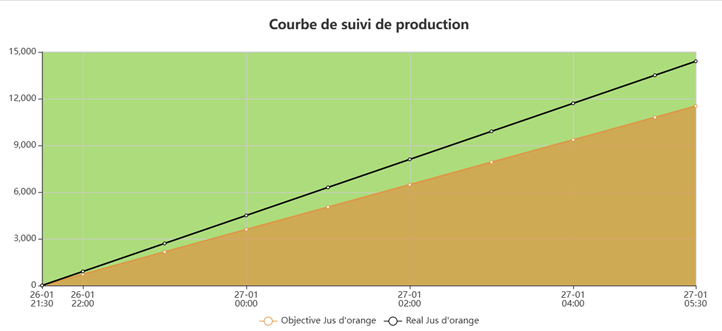
The Machine Performance Curve KPI displays, in real time on your dashboard, a chart comparing the actual production of a PerfTrak machine with the production target defined for the current product. The KPI works on the basis of work shifts and lets you follow the current shift as well as the two previous ones.
Example use cases
Live tracking of the shift's progress — A team leader displays the curve for the current shift to continuously check that actual production is keeping up with the target. A visible gap between the two curves signals a delay to catch up.
Debriefing the previous shift — A production manager configures the KPI on "Previous shift (S-1)" to analyse, at the start of the day, the performance of the shift that has just ended and identify any gaps.
Comparing shifts — A manager creates two KPIs side by side, one on the current shift and one on the previous shift, to visually compare the performance of two successive teams.
Visual alert on a workshop screen — A production director displays the curve on a TV screen in the workshop. The gap between the green area (target) and the orange area (actual) is immediately visible to everyone.
Creating and configuring a Machine Performance Curve KPI
Step 1 — Create the KPI
Go to your dashboard.
Click Add New KPI, then select PERFTRAK machine as the machine type and Machine Performance Curve as the KPI type.
Step 2 — General settings
| Field | Required | Description |
|---|---|---|
| Name | Yes | Free name for the KPI, displayed above the chart (e.g. "Target") |
| Machine | Yes | A PerfTrak machine within your perimeter |
| Interval | Yes | Work shift the tracking is displayed for |
Step 3 — Select the interval
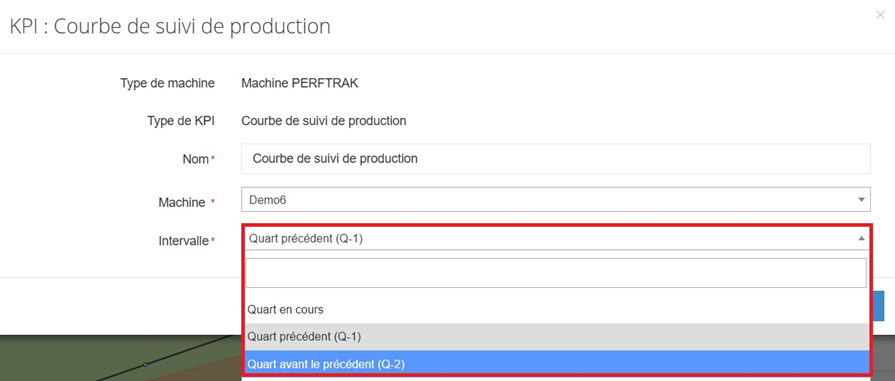
The interval is limited to work shifts:
| Option | Description |
|---|---|
| Current shift | Real-time tracking of the active work shift |
| Previous shift (S-1) | Data from the shift immediately before |
| Previous twice shift (S-2) | Data from the shift before that |
⚠️ Work shifts must have been created and assigned to the reference machine beforehand, in Setup > Shifts, for this KPI to work.
Step 4 — Save
Click Save. The KPI appears immediately on your dashboard and updates in real time.
Reading the KPI
The KPI is displayed as a chart with two curves and coloured areas:
| Element | Description |
|---|---|
| Horizontal axis | Time axis covering the duration of the selected shift |
| Vertical axis | Number of pieces produced (cumulative) |
| Orange curve (Target) | Linear progression of the production target, based on the theoretical pace of the current product |
| Black curve (Actual) | Actual progression of the cumulative production over time |
| Green area | Area above the target curve, representing the available margin |
| Orange area | Area below the target curve, representing the progress towards the target |
| Legend | At the bottom of the chart, identifies the Target and Actual curves with the product name |
When the black curve (actual) is below the orange curve (target), production is behind the target. When it catches up or goes above it, the target is reached or exceeded.
Edge cases and points to watch
Work shifts not configured. This KPI requires shifts to be created and assigned to the machine. Without that configuration, the KPI cannot work. Go to Setup > Shifts to set them up.
Machine outside your perimeter. Only the PerfTrak machines included in your perimeter are offered for selection. If a machine is missing, contact your administrator to check your access rights.
Product change during the shift. If several products were manufactured during the shift, the target curve adapts to the current product. The legend shows the name of the active product.
Current shift with little data. At the start of a shift, the actual curve only has a few points. The chart fills in progressively over time.
Deleting a dashboard. Deleting an account (manager or administrator) deletes the dashboards associated with it, including the KPIs they contain.
FAQ
Can I create several Machine Performance Curve KPIs for the same machine? Yes. You can for instance create one KPI on the current shift and another on the previous shift for the same machine, and display them side by side.
Does the KPI show history beyond the shifts? No. The KPI is limited to the last three shifts (current, S-1, S-2). For a longer history, use the reports or other KPIs such as Product Count.
Can I share this KPI with other users? The KPI is visible on the dashboard. Any user who has the machine in their perimeter and access to the dashboard will be able to see it.
How often is it updated? The KPI refreshes automatically, in real time, with the data sent by the machine.
Where does the target shown on the chart come from? The target is calculated from the theoretical pace defined on the product being manufactured. It is drawn as a straight line over the duration of the shift.