The Performance history tab lets you view the losses and the performance of your PaceTrak workstations. For each tool (efficiency history, losses Pareto, by operator, by machine, by product, by shift), select the perimeter (plant, workshop, machine), the loss level (1 or 2) and the period (day, week, month, year).
The loss categories (Loading, Availability, Performance, Quality, Custom) are automatically displayed and selected; click on them to deselect them and isolate certain stoppage causes.
1. Efficiency history
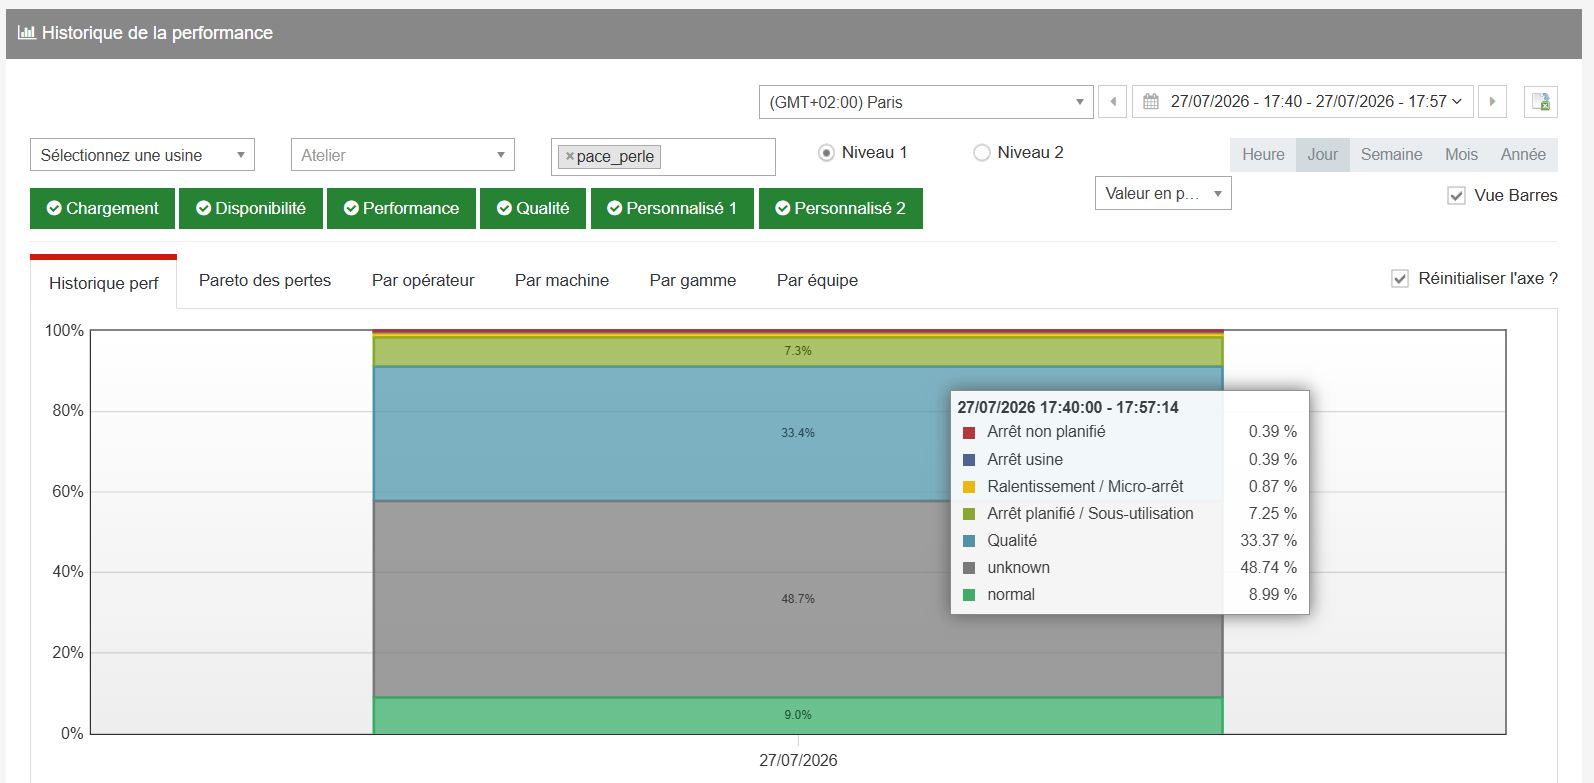
The home page is made up of two histograms representing the performance of the workstations. Hover over a bar to display the details. You can zoom in with the mouse wheel; the small histogram at the bottom lets you select a period by drawing a rectangle over the area you want to study.
2. Losses Pareto
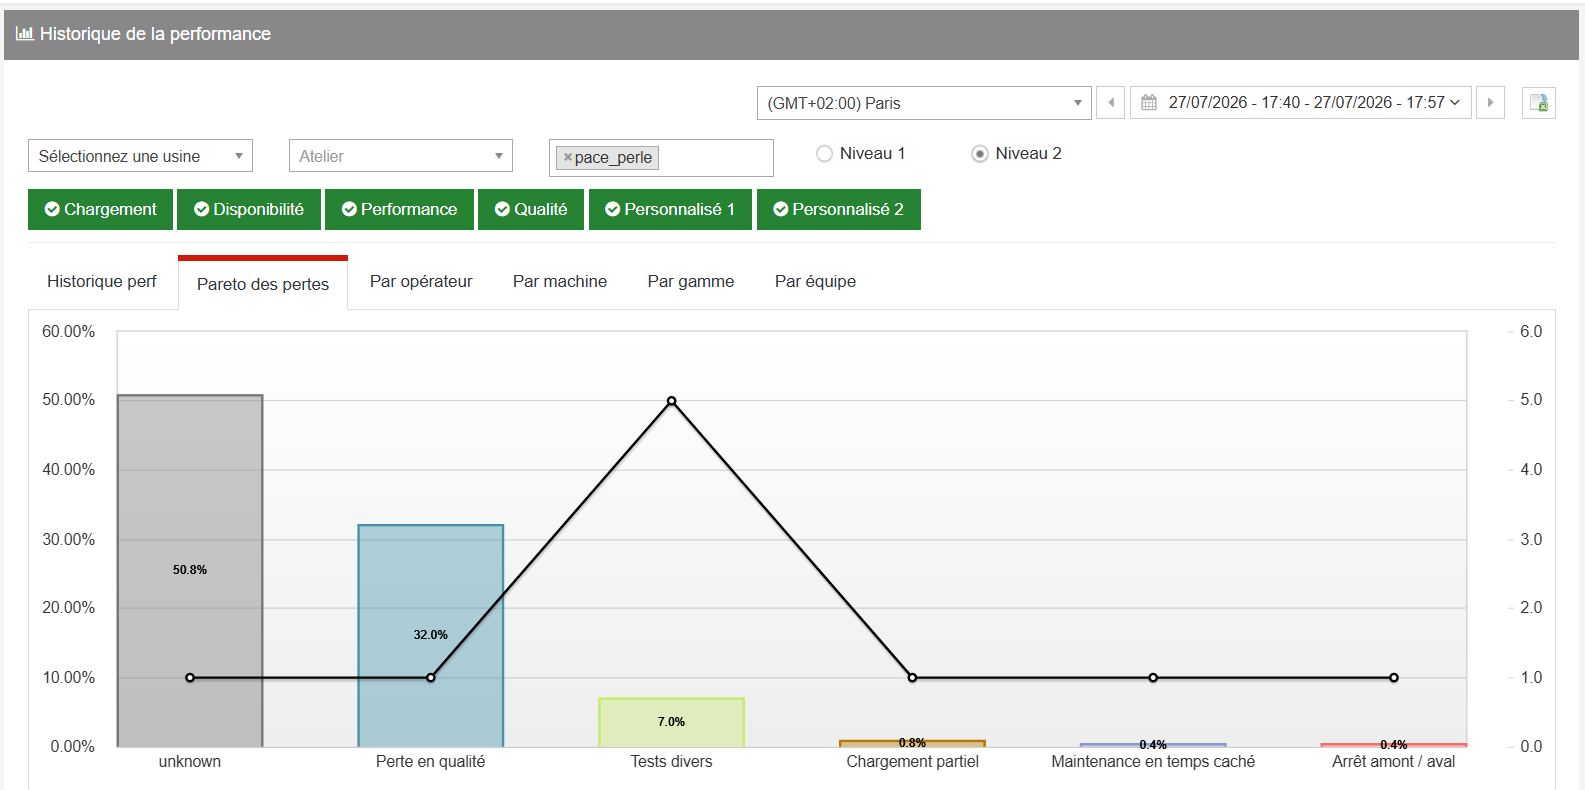
"20 % of problems generate 80 % of stoppages." This histogram enables you to visualise and quantify the main performance losses, and to monitor the impact of the improvement actions undertaken.
3. By operator
As individual performance tracking is forbidden in some countries, tracking is done by shift: create one account per shift, not per operator. This tool lets you visualise the problems encountered by the team so that corrective actions can be taken.
4. By machine (workstation) and by product (routing)
Monitoring by machine gives you an overview of your fleet: recurring problems, condition and utilisation of the workstations. Monitoring by product identifies the routings with recurring losses and locates the source of the problem according to the loss tree you have configured — the more complete the tree, the easier the identification.
5. Exporting
The export icon next to the period gives access to the following formats: raw data, graph data, simplified losses, A4 PDF and Letter PDF.