Introduction
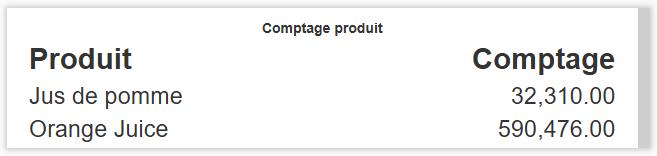
The Product Count KPI displays, in real time on your dashboard, the number of pieces produced by a PerfTrak machine over a given time interval. The result is presented as a table listing each product manufactured and its count. You can also use production orders, and choose to display the raw value (pulses) or the net value (pieces).
Example use cases
Daily production tracking — A line manager wants to know the total number of pieces produced per machine over the last 24 hours. They create a Product Count KPI with the "Last 24 hours" interval and check the result every morning.
Weekly production review — A workshop manager configures a KPI over the last 7 days to get a consolidated view of production per product reference, without having to export a report.
Tracking by production order — A planner enables the "Use production orders" option to follow the product count by production order rather than by reference, and check the progress of each batch.
Checking the multiplier coefficient — A technician using a grouping coefficient on their machine enables the "Display Raw Value" option to compare the number of sensor pulses with the calculated number of pieces, and make sure the coefficient is set correctly.
Creating and configuring a Product Count KPI
Step 1 — Create the KPI
Go to your dashboard.
Click Add New KPI, then select PERFTRAK machine as the machine type and Product Count as the KPI type.
Step 2 — General settings
| Field | Required | Description |
|---|---|---|
| Name | Yes | Free name for the KPI, displayed above the table (e.g. "Product count – Press 12") |
| Machine | Yes | A PerfTrak machine within your perimeter |
| Interval | Yes | Time window the count is calculated over |
Step 3 — Select the time interval
The interval determines the data window used for the calculation. Available options:
| Category | Options |
|---|---|
| Sliding hours | Last hour · Last 8 hours · Last 12 hours · Last 24 hours |
| Sliding days | Last 7 days · Last 31 days |
| Calendar periods | Previous week · Previous month |
| Sliding months | Previous 3 · 6 · 12 months |
| Shifts | Current shift · Previous shift (S-1, S-2, S-3) · Since the beginning of the shift |
| Custom | Since a specific time of the week · Operational day · Operational yesterday · Current production |
💡 The "Current shift" interval can only be used after shifts have been created and assigned to the reference machine, in Setup > Shifts.
Step 4 — Configure the display options
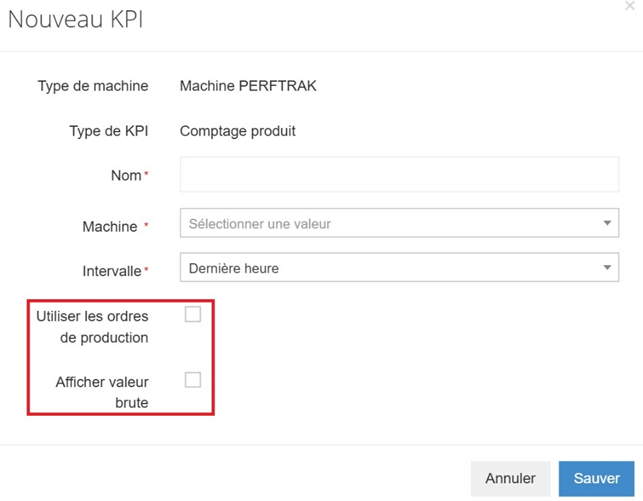
Two optional settings are available as checkboxes:
| Option | Description |
|---|---|
| Use production orders | Enables tracking by production order. The production orders must be configured beforehand. |
| Display Raw Value | Displays the number of sensor pulses collected instead of the calculated number of pieces — useful when a multiplier coefficient is in place. |
💡 If no multiplier coefficient is configured on the machine, the raw and net values are identical.
Step 5 — Save
Click Save. The KPI appears immediately on your dashboard and updates in real time.
Reading the KPI
The KPI is displayed as a table with two columns:
| Column | Description |
|---|---|
| Product | Name of the product reference manufactured over the selected interval |
| Count | Number of pieces, or of pulses if "Display Raw Value" is ticked |
If several products were manufactured over the period, each appears on its own row with its own count.
Edge cases and points to watch
No data over the selected interval. If no piece was produced over the chosen period, the KPI shows an empty table or a value of zero. Check that the interval suits the machine's production rhythm.
Machine outside your perimeter. Only the PerfTrak machines included in your perimeter are offered for selection. If a machine is missing, contact your administrator to check your access rights.
Multiplier coefficient and raw value. If you use a multiplier (grouping) coefficient, the number of pieces displayed is the number of pulses multiplied by that coefficient. Tick "Display Raw Value" to see the number of pulses actually collected by the sensor and check that the setting is consistent.
Several products over the period. If several product references were manufactured over the selected interval, they all appear in the table. The count is broken down per product.
Production orders not configured. If you tick "Use production orders" without having configured any beforehand, the KPI cannot display a usable result. Configure your production orders first, in the dedicated menu.
Deleting a dashboard. Deleting an account (manager or administrator) deletes the dashboards associated with it, including the KPIs they contain.
FAQ
Can I create several Product Count KPIs for the same machine? Yes. You can for instance create one KPI on the current shift and another over the last 7 days for the same machine, with different configurations.
Does the KPI show history? No. The Product Count KPI is a real-time visual. It displays the value calculated over the current interval.
Can I share this KPI with other users? The KPI is visible on the dashboard. Any user who has the machine in their perimeter and access to the dashboard will be able to see it.
How often is it updated? The KPI refreshes automatically, in real time, with the data sent by the machine.
What is the difference with the "Product Count on Last Hours" KPI? The "Product Count" KPI displays a total count as a table. The "Product Count on Last Hours" KPI adds a visual gauge with a target value, as a percentage, letting you see instantly whether the production target has been reached.