In this mode, the operator presses a button at the end of each task or subtask, and enters the root causes of the variances from the theoretical time at the end of the routing. No option needs to be ticked to activate this mode.
1. Launching a routing
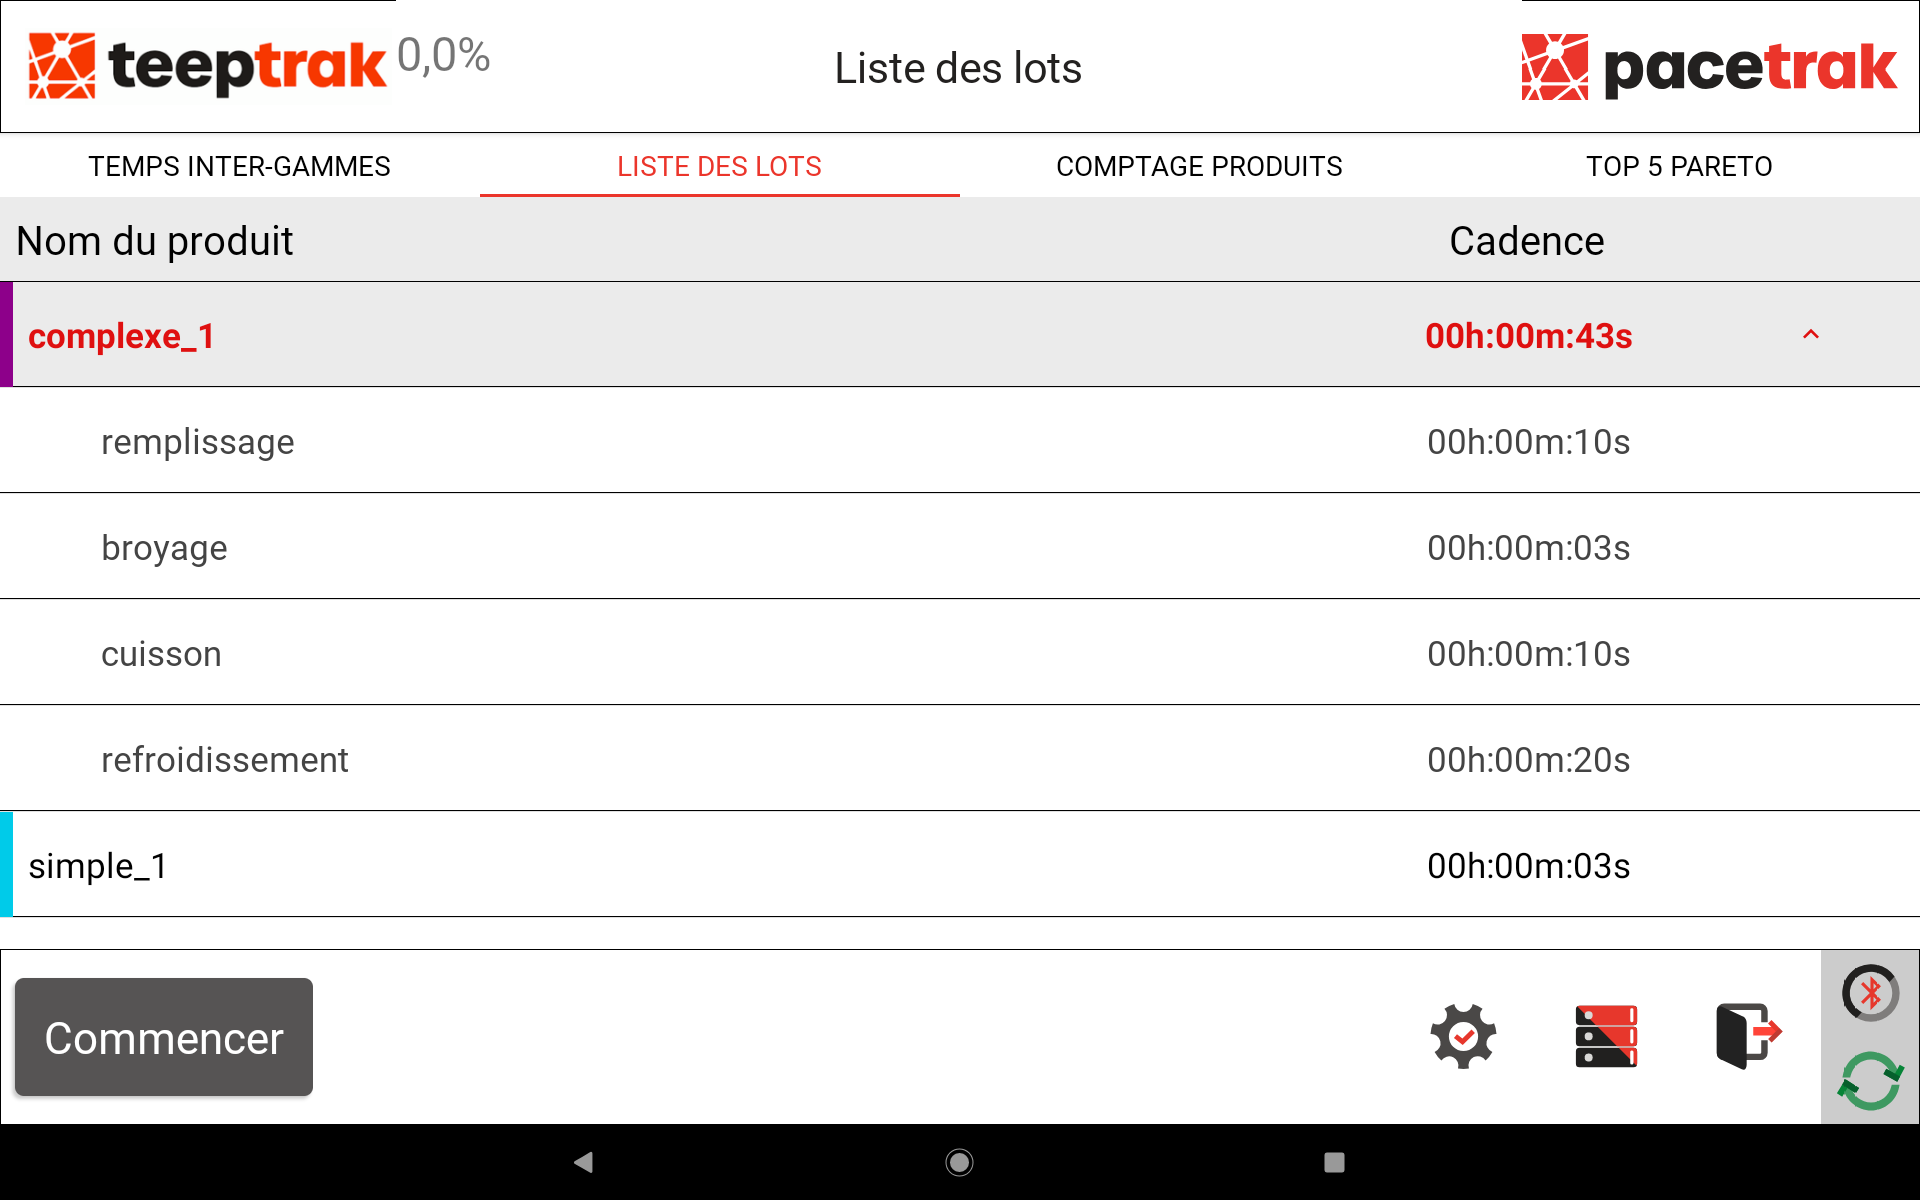
Depending on your configuration, two types of routing are available in the list of batches:
- single-task routings (one single task);
- multi-task routings: press the "v" to expand the subtasks (or sub-routings) that make up the overall task.
Select the routing, then press Start.
2. Performing the subtasks
The list of subtasks is displayed at the top, in the order defined on the platform. The screen shows the subtask in progress, the total time elapsed, the time still to be explained and the timer.
Press Task done at the end of each subtask. The circle on the right follows a colour code: green (normal time), orange (approaching the end of the theoretical cycle time), red (trigger time exceeded, a loss is in progress).
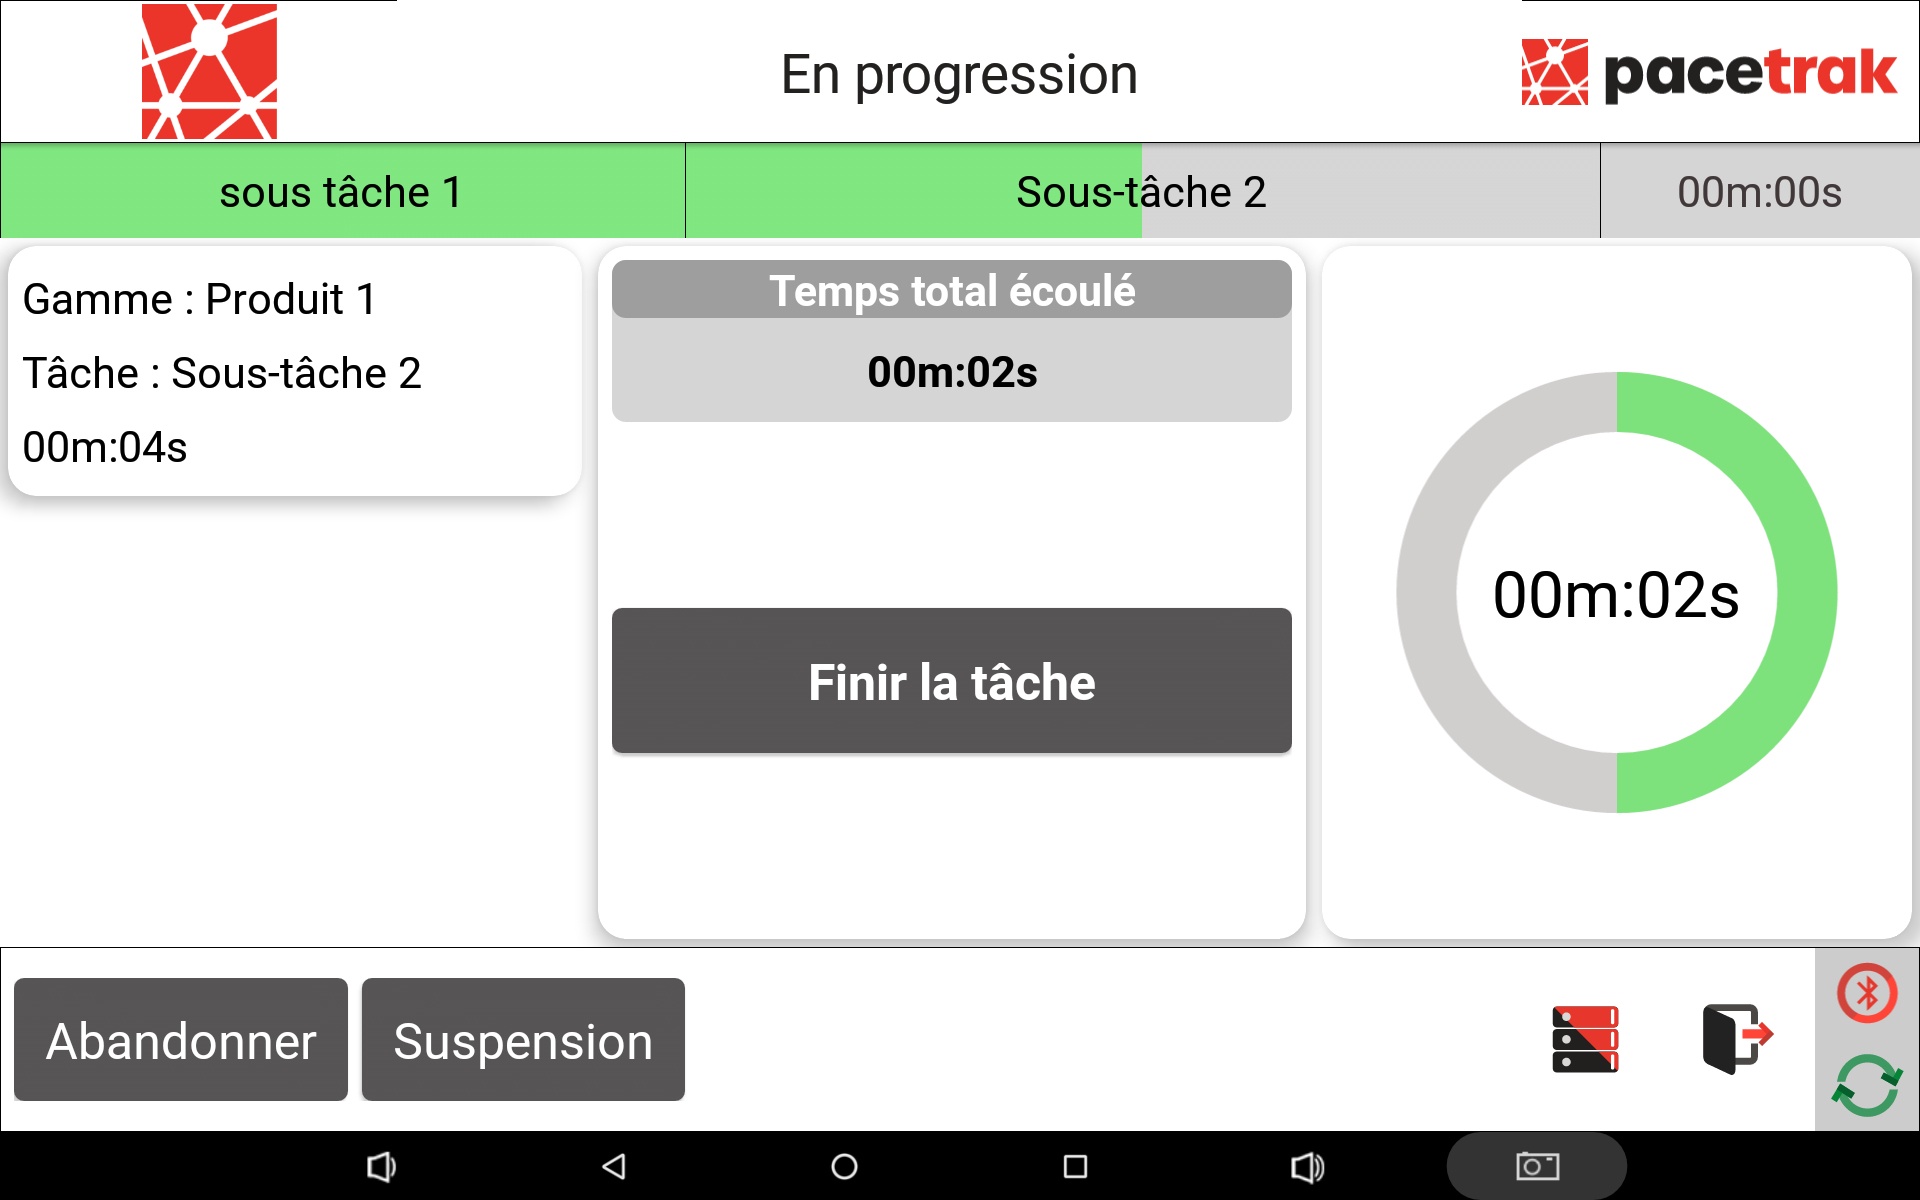
If the time is exceeded, the time to be explained is displayed in red.
3. Entering the root causes of the losses
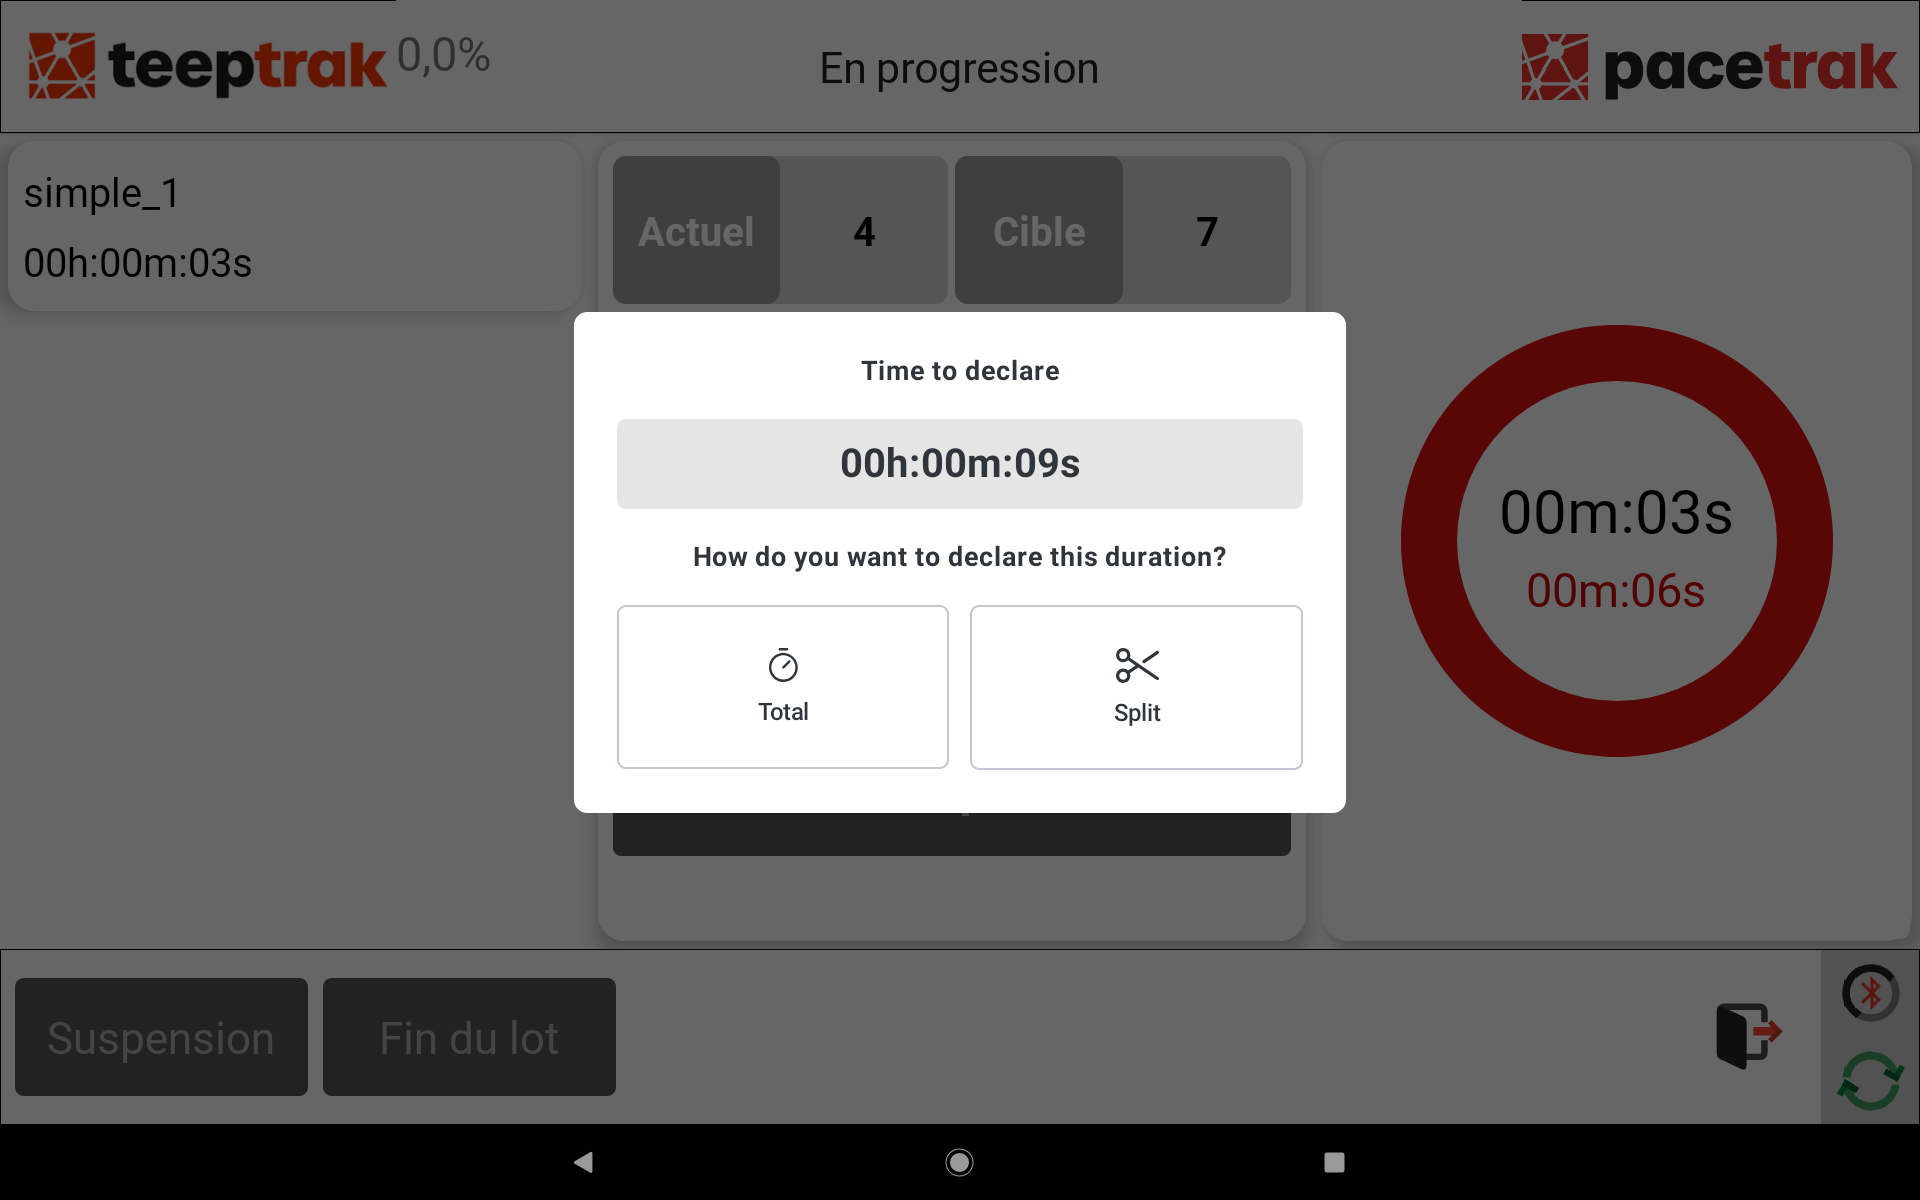
When explaining a variance, first choose its scope:
- Report all — the whole variance is assigned to the cause you are about to select;
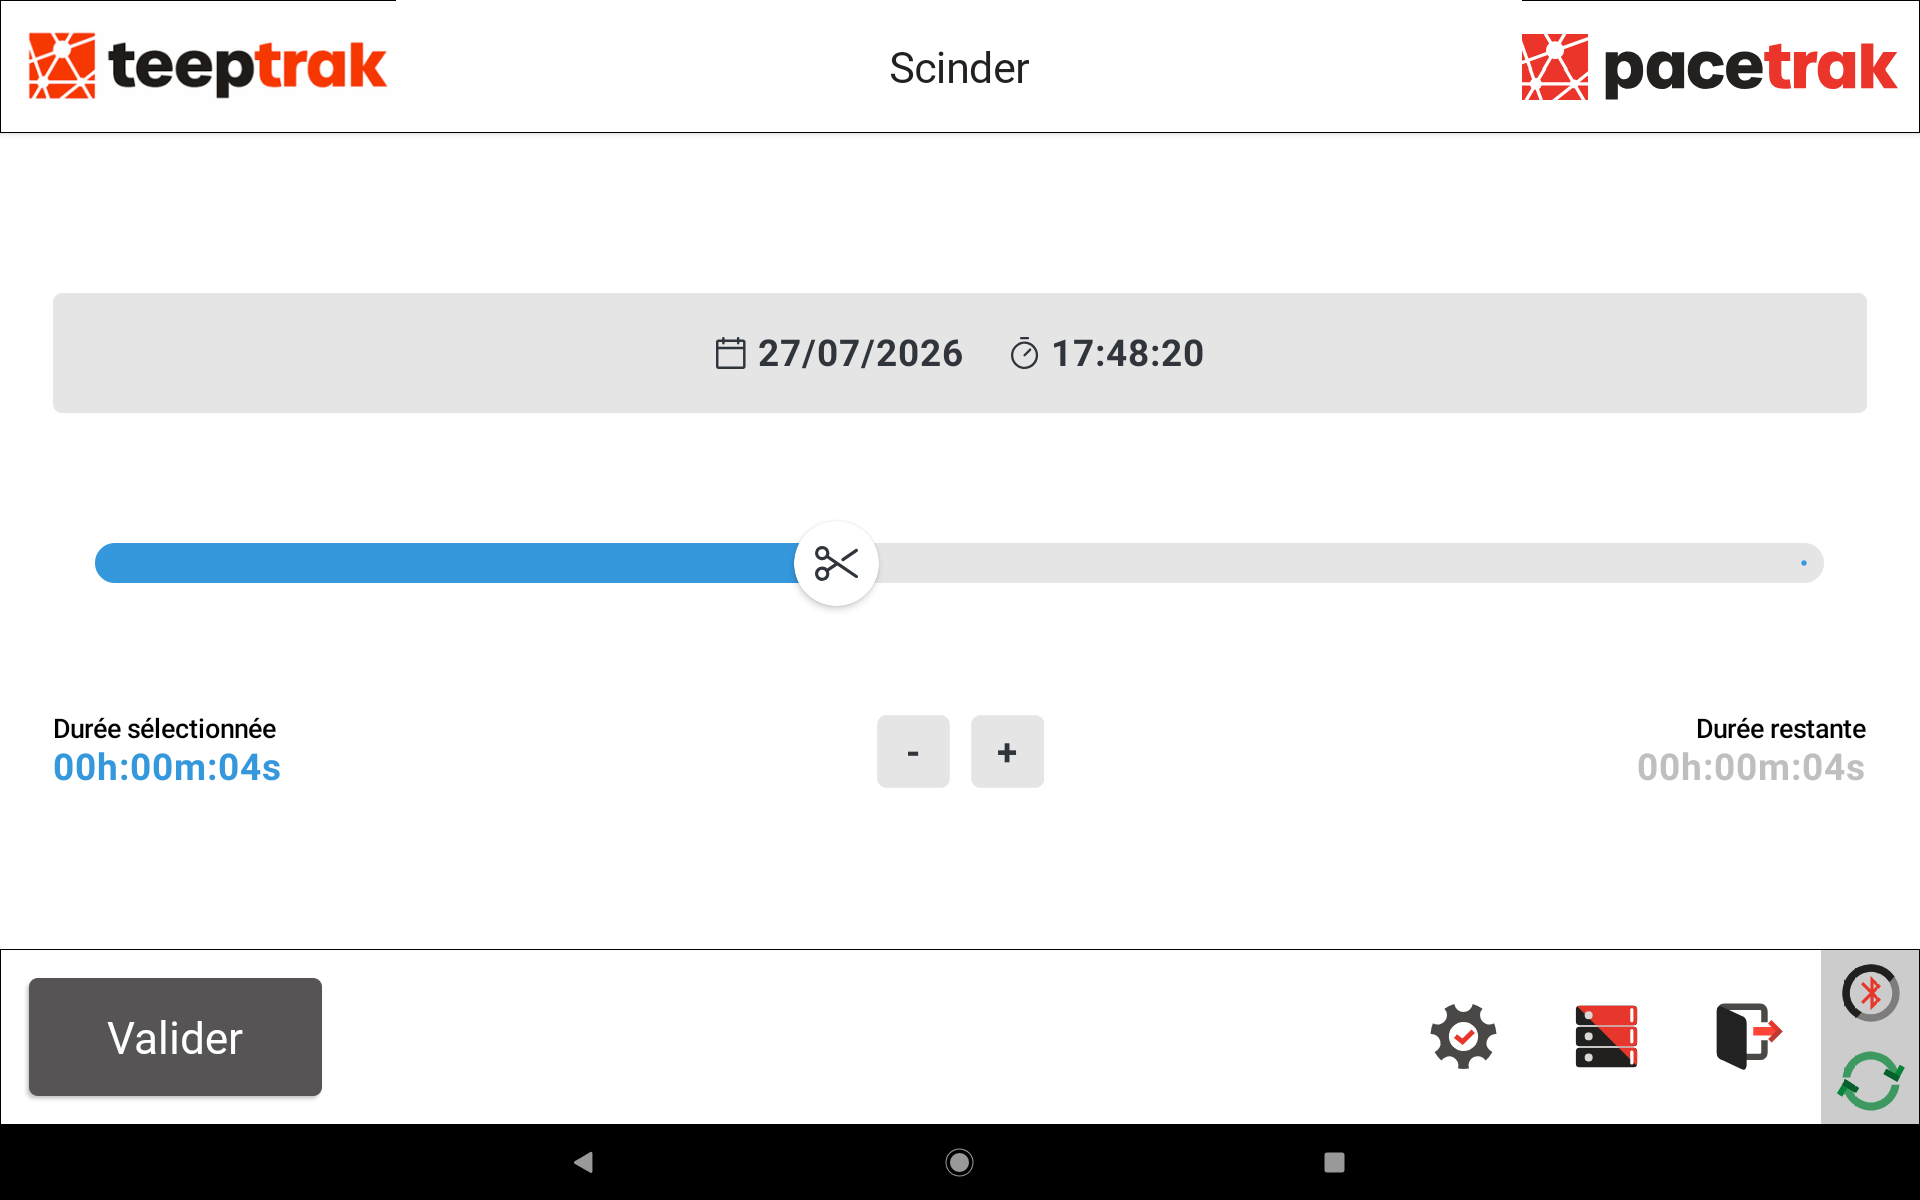
- Split — only part of the duration is assigned: position the cursor (scissors) or adjust it with the − and + buttons. The selected duration is displayed on the left, the remaining duration on the right. Press Validate.
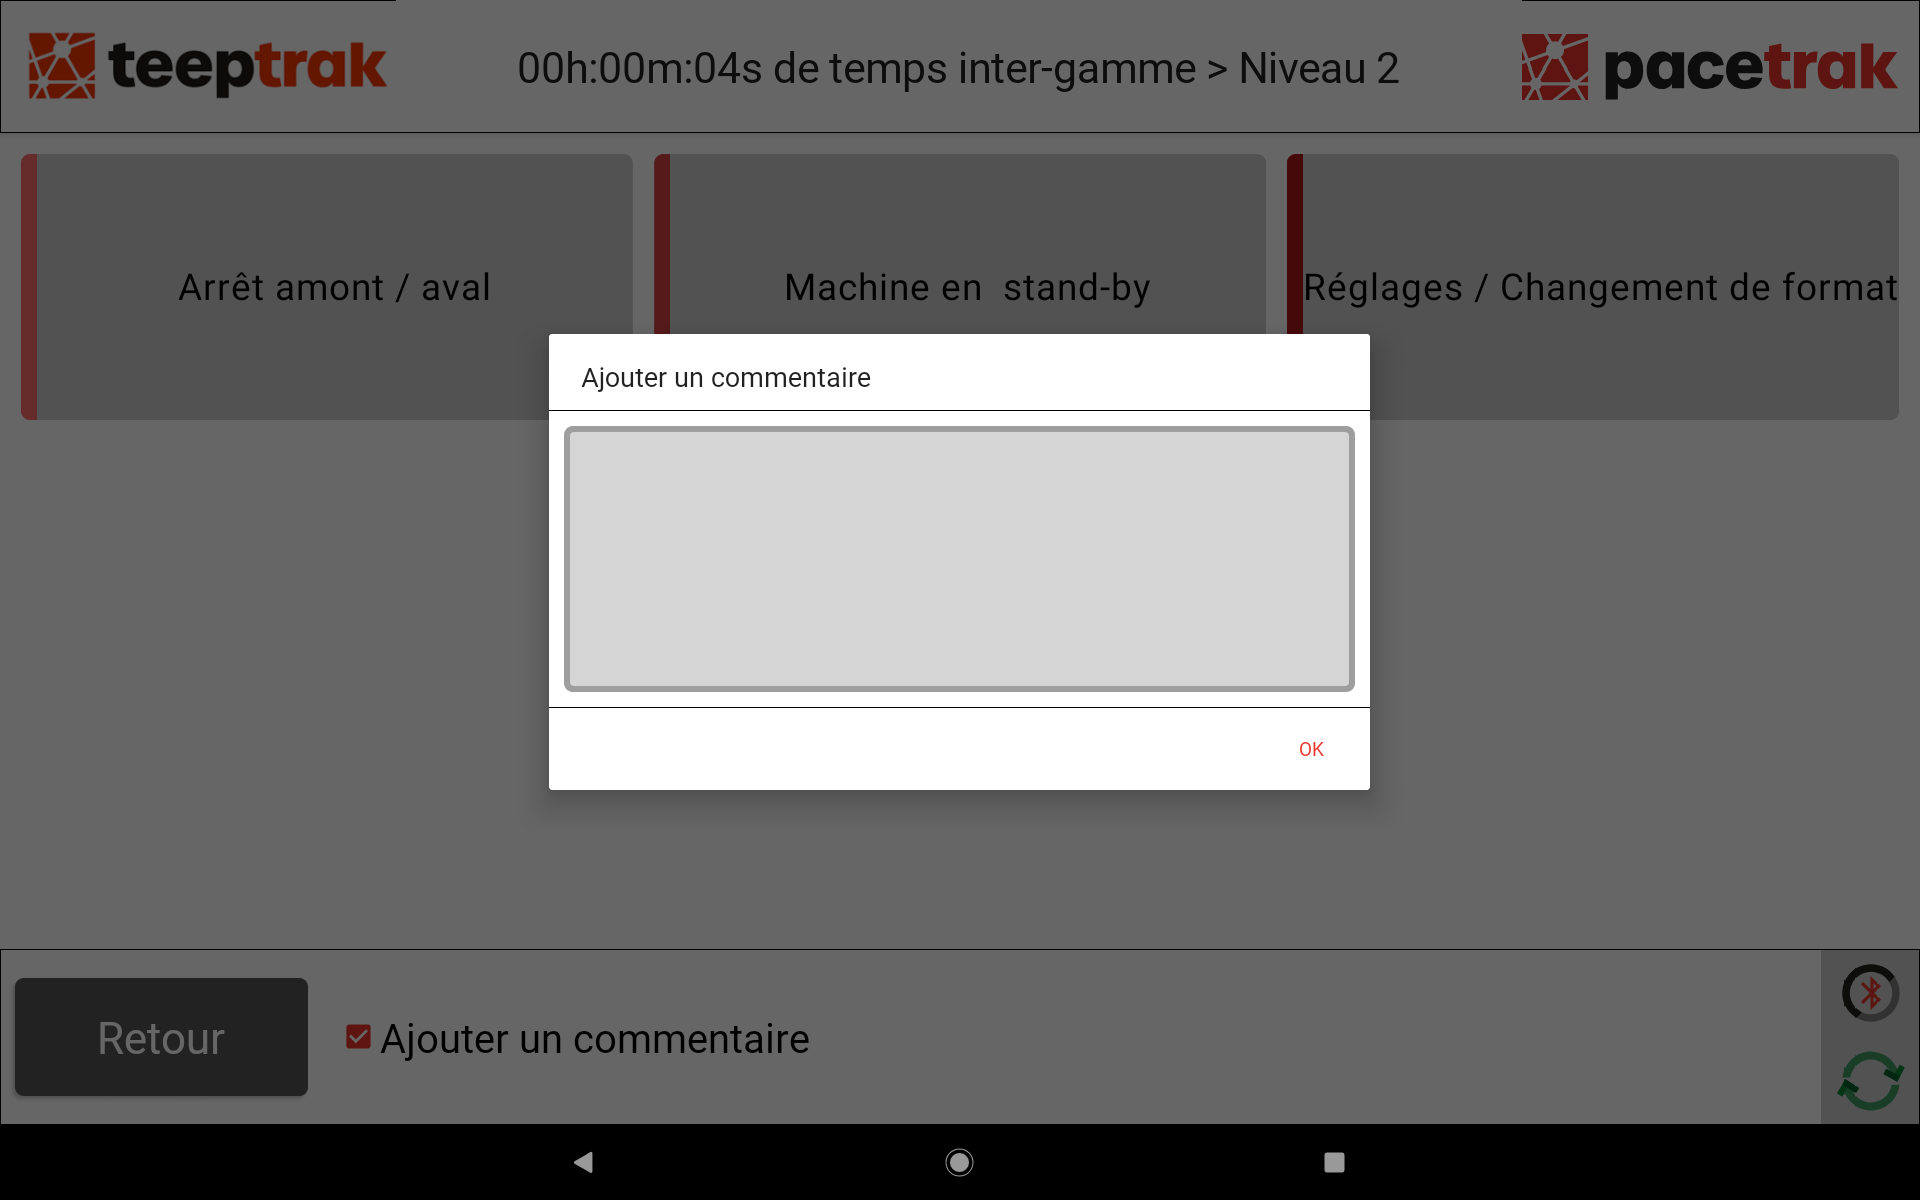
Then select the level 1 stoppage cause among the tiles displayed full screen, and the level 2 cause on the following screen.
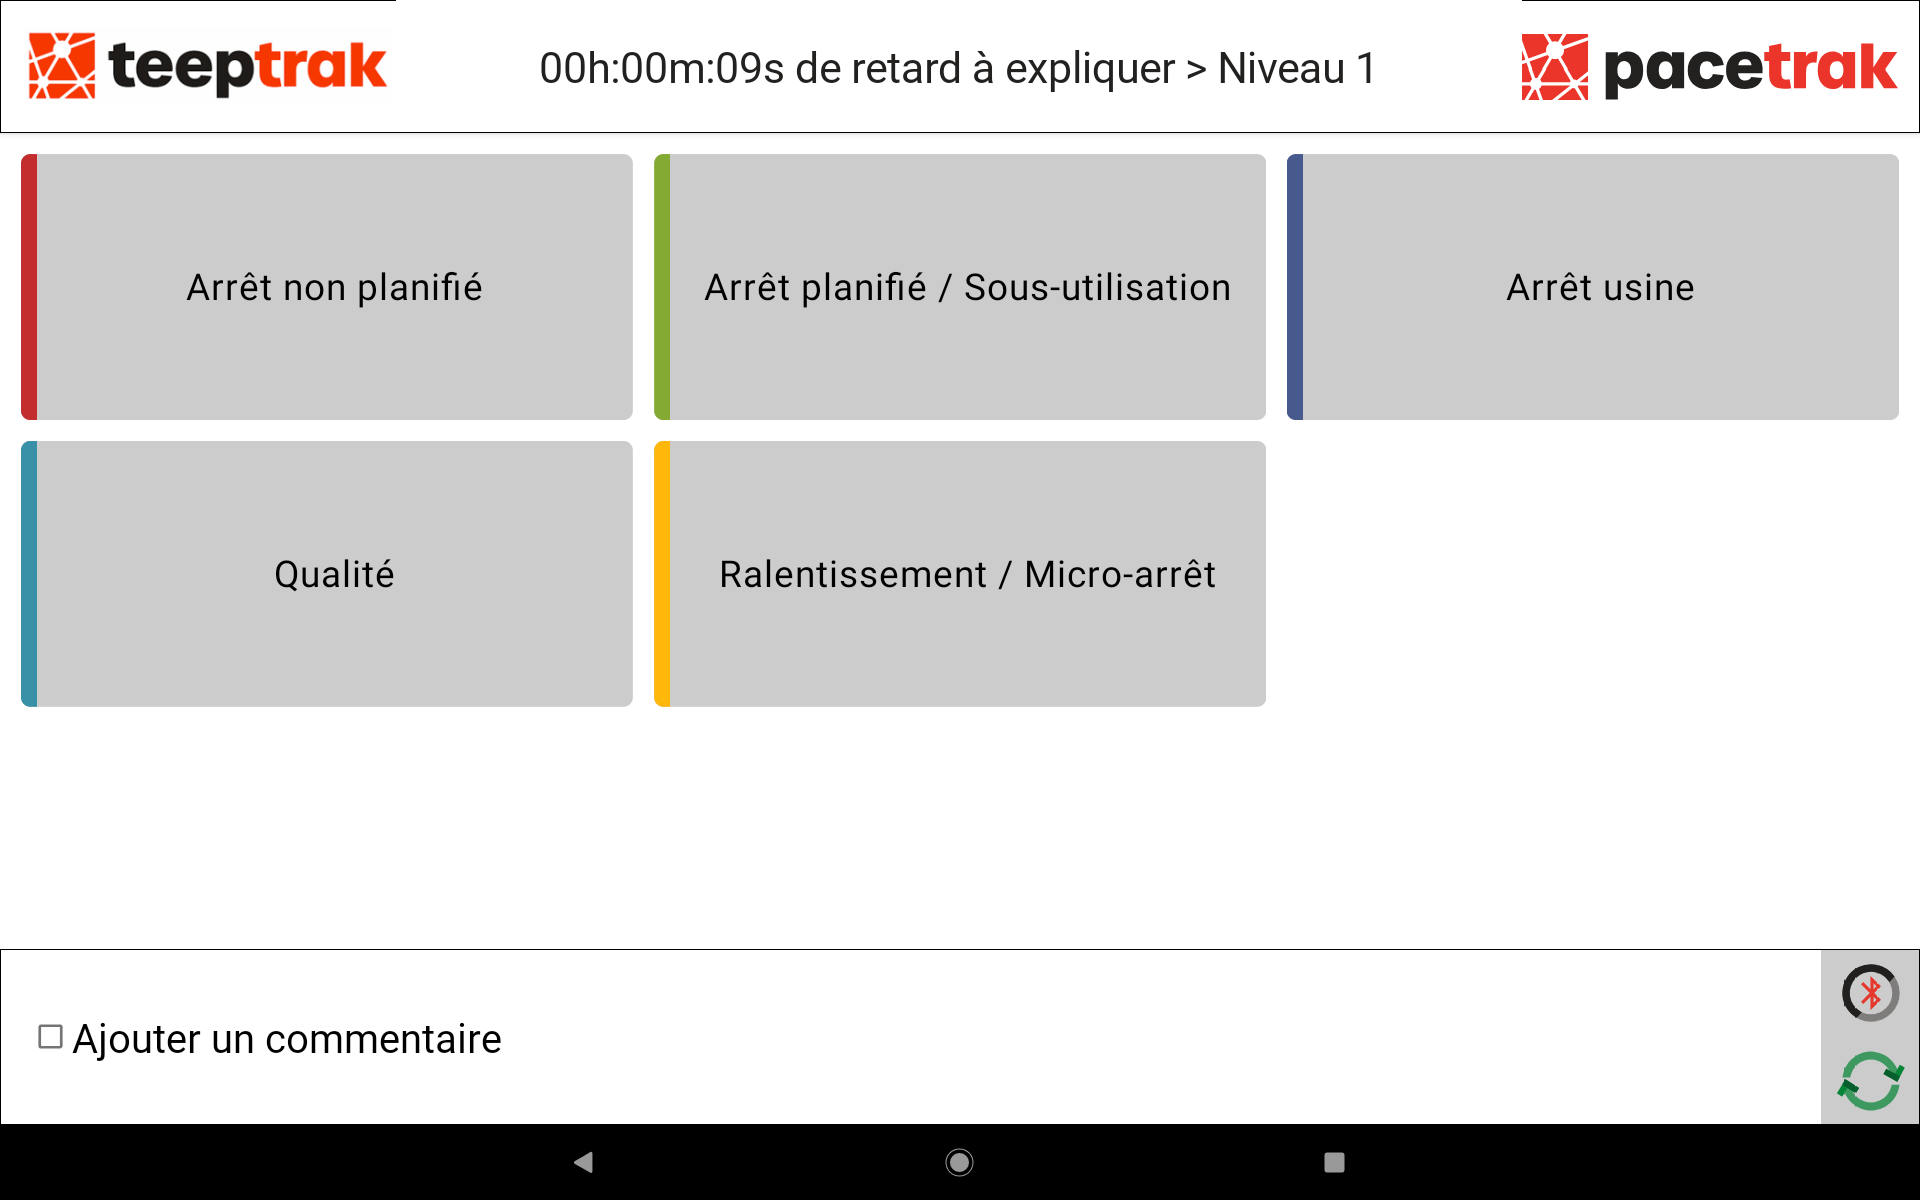
To add context, tick Add a comment at the bottom of the screen: an input window opens once the cause has been selected.
If you split the duration, repeat the operation for the remaining time, until the whole variance has been explained.
Note: since the July 2026 update, this loss entry interface follows the PerfTrak one, for a consistent experience across both solutions.