Pace Logs gives you a reliable overview of the status of your production, including the performance of your operators during their shift. It lists exhaustively all the production times, from the most recent to the oldest, around four main variables: the product, the operator/shift, the quantities produced and the associated type of losses.
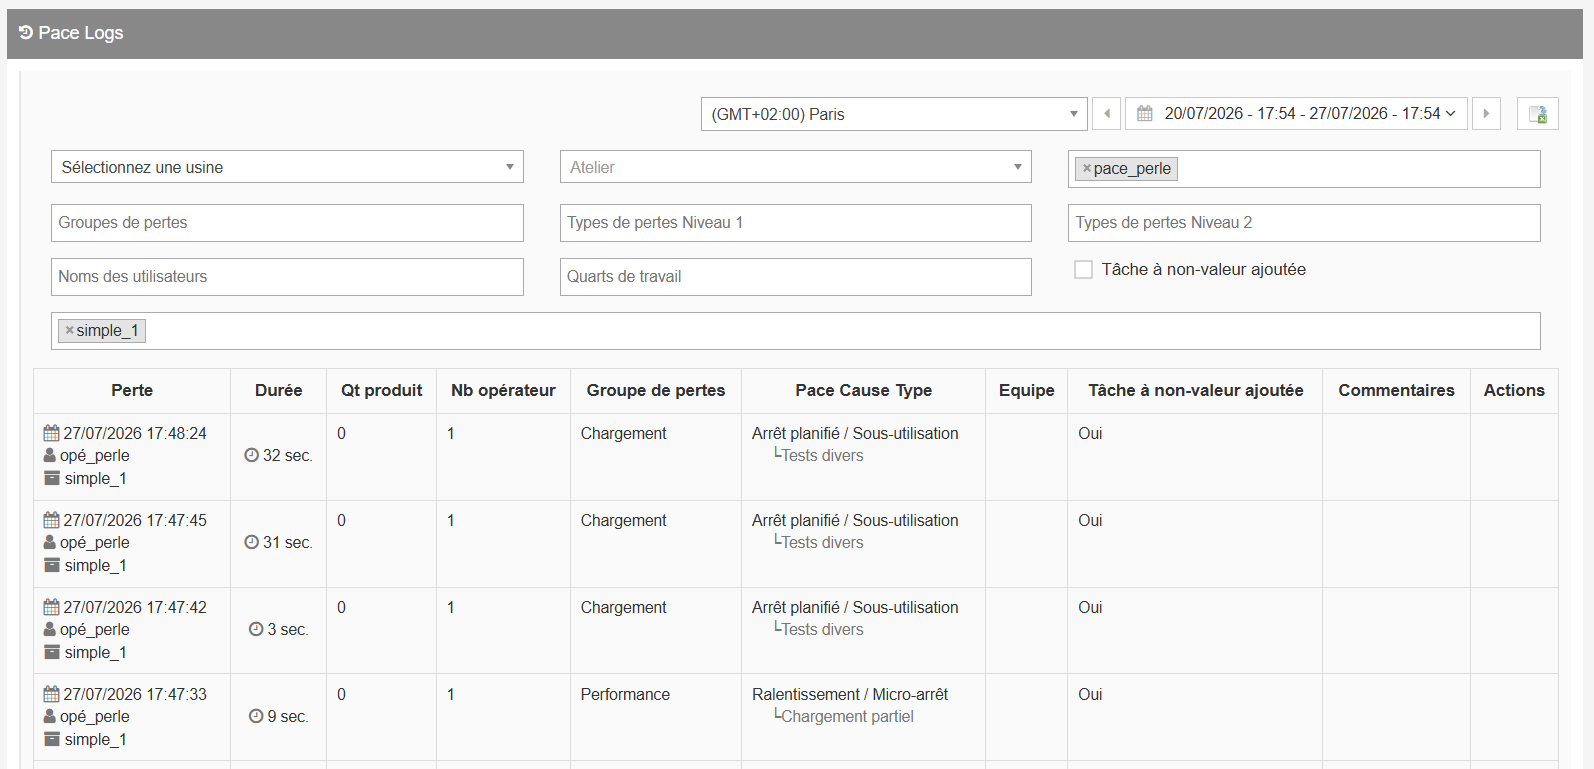
1. Filtering the data
In PaceTrak > Pace Logs, choose the perimeter (plants, workshops, machines) and the period (date and time), then refine if needed by loss groups, level 1 and level 2 cause types, users, shifts or products.
2. Reading the table
Each row presents a production period: start and end timestamps, production reference, machine name (the workstation entered on the tablet), user name (the operator logged in), product selected, quantity produced, number of operators, loss group and level 1 and level 2 causes, duration (in seconds), shift, non-value-added time and comments.
The Non-value-added time column indicates whether the period is considered a loss ("Yes": production was not effective) or normal production time ("No"). The Edit loss type button lets you correct the qualification directly from the table.
3. Exporting
The export icon (top right, next to the period) gives access to the following formats: raw data, graph data, A4 PDF and Letter PDF.