Introduction
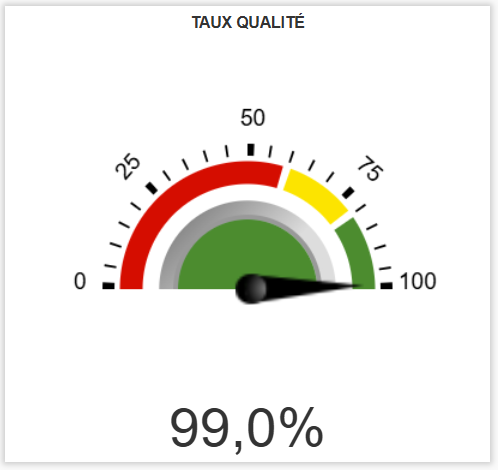
The Quality Rate KPI displays, as a real-time gauge on your dashboard, a ratio between pieces produced on a QualTrak machine. You freely define the numerator, the denominator, the period and the colour thresholds: the KPI then updates automatically with the production data.
Example use cases
- Real-time scrap rate tracking — A line manager wants to continuously monitor the percentage of scrapped pieces on a press. They create a KPI with, as numerator, the pieces attached to the level 1 "Dimensional scrap", and as denominator the total number of pieces produced. The gauge turns red as soon as the rate exceeds 5%.
- Good-parts rate per product reference — A quality manager wants to follow the proportion of conforming pieces on an assembly machine. They configure a KPI with the good parts as numerator and the total produced as denominator, over the last 8 hours.
- Comparing teams through the shift — A workshop manager creates two identical KPIs, one on the "Current shift" and the other on the "Previous shift (S-1)", to visually compare quality from one shift to the next.
- Tracking a specific defect type — A quality engineer wants to isolate a particular defect (for example "Appearance defect") among the level 1 losses of the loss tree, and follow how it evolves relative to the number of good parts.
Creating and configuring a Quality Rate KPI
Step 1 — Create the KPI
- Go to your dashboard.
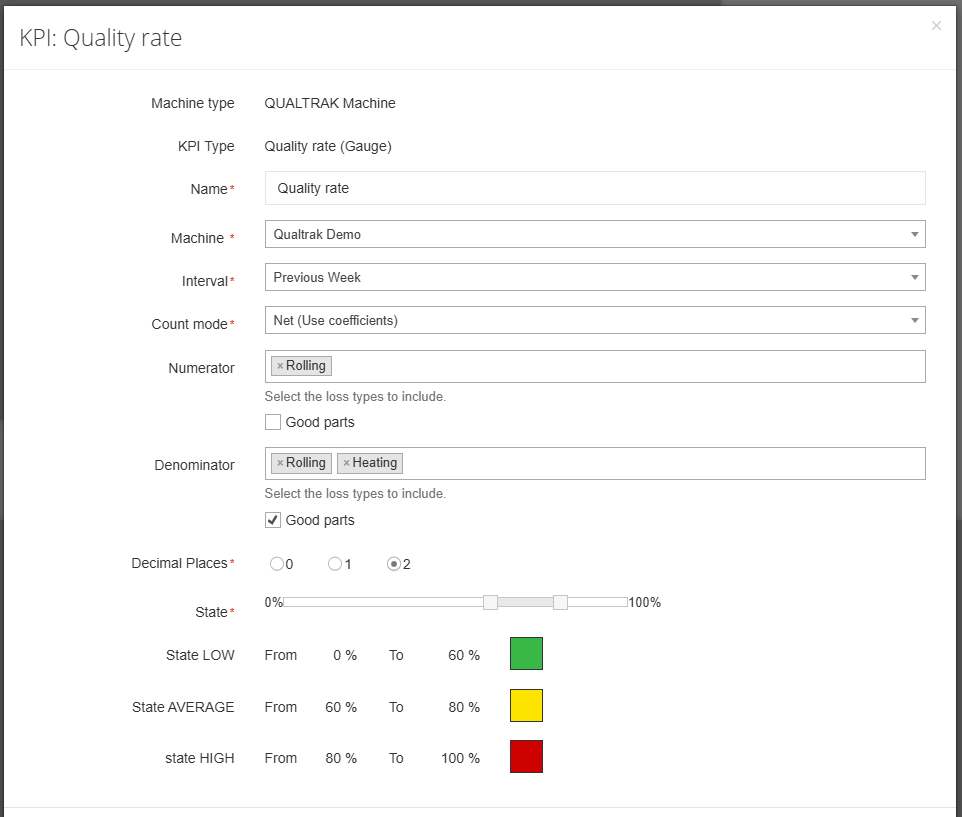
- Click Add New KPI, then select QUALTRAK machine as the machine type and Quality Rate (gauge) as the KPI type.
Step 2 — General settings
| Field | Required | Description |
|---|---|---|
| Name | Yes | Free name for the KPI, displayed on the gauge (e.g. "Scrap rate – Press 12") |
| Machine | Yes | A QualTrak machine within your perimeter |
Step 3 — Define the calculation
The rate displayed is the result of: Numerator ÷ Denominator × 100%
Numerator (multiple choice):
- Number of good parts
- Number of pieces attached to one or more level 1 losses of the loss tree
Denominator (multiple choice):
- Number of good parts
- Number of pieces attached to one or more level 1 losses of the loss tree
💡 Tip — For a classic scrap rate, choose as numerator the pieces of the scrap level 1 loss or losses, and as denominator the total pieces produced, by selecting both the good parts and all the level 1 losses.
Step 4 — Choose the counting mode
The calculation can be performed in two modes:
- By pulses (raw value) — Each sensor pulse is counted individually. This is the raw data sent by the sensor.
- By pieces (net value) — The pulses are converted into a number of pieces, taking into account the grouping coefficient defined on each product.
💡 When does the counting mode make a difference?
If a single product is manufactured over the time interval, or if all the products have the same grouping coefficient, both modes give the same result.
However, if several products with different grouping coefficients are manufactured over the period, the mode you choose changes the resulting ratio. Choose the mode according to what you want to measure: sensor performance (pulses) or product performance (pieces).
Step 5 — Select the time interval
The interval determines the data window used for the calculation. Available options:
| Category | Options |
|---|---|
| Sliding hours | Last hour · Last 8 hours · Last 12 hours · Last 24 hours |
| Sliding days | Last 7 days · Last 31 days |
| Calendar periods | Previous week · Previous month |
| Sliding months | Previous 3 · 6 · 12 months |
| Shifts | Current shift · Previous shift (S-1, S-2, S-3) · Since the beginning of the shift |
| Custom | Since a specific time of the week, Operational day, Operational yesterday |
Step 6 — Configure the gauge colours
You split the 0 – 100% range into 3 colour bands. Each band is defined by a colour and a threshold value.
Example for a scrap rate:
| Band | Colour | Threshold |
|---|---|---|
| 0% → 3% | 🟢 Green | Nominal quality |
| 3% → 8% | 🟠 Orange | Watch |
| 8% → 100% | 🔴 Red | Alert |
Step 7 — Save
Click Save. The KPI appears immediately on your dashboard and updates in real time.
Edge cases and points to watch
Can the rate exceed 100%?
No, if the numerator is a subset of the denominator (for example scrap / total produced). However, if you choose an independent numerator and denominator (for example pieces of a specific level 0 loss / good parts), the ratio can theoretically exceed 100%. The colour thresholds remain defined between 0 and 100%.
No data over the selected interval
If no piece was produced over the chosen period, the gauge shows 0% or an indication that data is missing. Check that the interval suits the machine's production rhythm.
Machine outside your perimeter
Only the QualTrak machines included in your perimeter are offered for selection. If a machine is missing, contact your administrator to check your access rights.
Several level 1 losses selected
When you select several level 1 losses of the loss tree, in the numerator or the denominator, the piece quantities of those levels are added together.
Several products over the period
If several different products are manufactured over the selected interval, they are all taken into account in the calculation. Pay attention to the counting mode chosen (by pulses or by pieces): when products have different grouping coefficients, the rate calculated by pulses and the one calculated by pieces will not be identical. Choose the mode that matches what you want to measure.
Modifying an existing KPI
You can change a KPI's configuration at any time — name, machine, calculation, interval, colours. The gauge is recalculated immediately on the basis of the new configuration.
FAQ
Can I create several Quality Rate KPIs for the same machine?
Yes. You can for instance create a "Global scrap rate" KPI and an "Appearance defect rate" KPI on the same machine, with different calculation settings.
Does the KPI show history?
No. The Quality Rate KPI is a real-time gauge. It displays the value calculated over the current interval.
Can I share this KPI with other users?
The KPI is visible on the dashboard. Any user who has the machine in their perimeter and access to the dashboard will be able to see it.
How often is it updated?
The KPI refreshes automatically, in real time, with the data sent by the machine.