Introduction
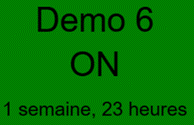
The Machine Status KPI displays, in real time on your dashboard, the operating status of a PerfTrak machine through a green / orange / red colour code. At a glance you can tell whether the machine is running, in a micro-stoppage or stopped, optionally with the duration, the current stoppage cause and the productive duration.
Example use cases
Supervising a machine fleet on a large screen — A workshop manager displays a dashboard on a TV screen with one Machine Status KPI per piece of equipment. The colour changes instantly as soon as a machine stops, allowing an immediate reaction.
Tracking the duration of an ongoing stoppage — A team leader enables the "Display issue duration" option to see how long a machine has been stopped and decide whether to intervene.
Showing the stoppage cause to the operator — An operator looks at the dashboard on their tablet and immediately sees the stoppage cause qualified by their colleague on the previous shift, without having to open another screen.
Distinguishing micro-stoppages from long stoppages — A methods engineer enables the orange status to visually separate micro-stoppages (below a defined threshold) from prolonged stoppages (red), and to focus improvement actions on the right levers.
Creating and configuring a Machine Status KPI
Step 1 — Create the KPI
Go to your dashboard.
Click Add New KPI, then select PERFTRAK machine as the machine type and Machine Status (On/Off) as the KPI type.
Step 2 — General settings
| Field | Required | Description |
|---|---|---|
| Name | Yes | Free name for the KPI, displayed on the visual (e.g. "Machine status – Press 12") |
| Machine | Yes | A PerfTrak machine within your perimeter |
Step 3 — Choose the information displayed
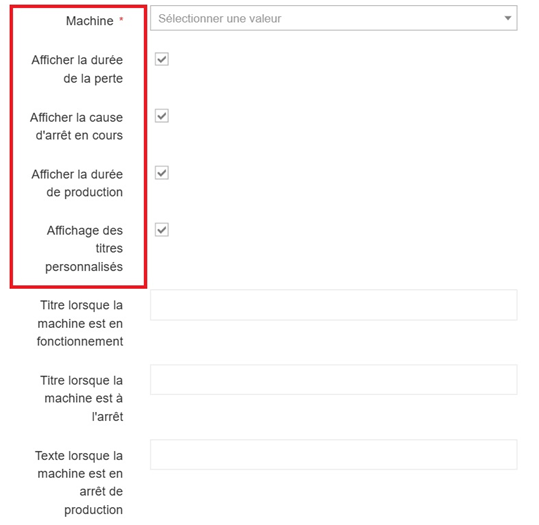
Four display options are available as checkboxes. Enable the ones that match your need:
| Option | Description |
|---|---|
| Display issue duration | Shows how long the machine has been stopped |
| Display issue type | Shows the qualified loss category associated with the current stoppage |
| Display productive duration | Shows how long the machine has been running |
| Display custom naming | Lets you replace the default labels with your own texts |
Step 4 — Customise the labels (optional)
If you tick "Display custom naming", three additional fields appear:
| Field | Default value | Description |
|---|---|---|
| Title when the machine is running | Machine running | Text displayed on the green background |
| Title when the machine is stopped | Machine stopped | Text displayed on the red (or orange) background |
| Text when production is stopped | Production stoppage | Text displayed during a planned production stoppage |
Step 5 — Enable the orange status (optional)
By default, the KPI uses two colours: green (running) and red (stopped). To add an intermediate orange status representing micro-stoppages:
- Go to Setup > General Configuration.
- In the Performance section, tick "Enable orange for machine status".
- Set the duration, in seconds, beyond which the status switches from orange to red.

💡 The orange status applies to every Machine Status KPI in the project. It is not a per-KPI setting.
Step 6 — Save
Click Save. The KPI appears immediately on your dashboard and updates in real time.
Edge cases and points to watch
The machine does not appear in the list. Only the PerfTrak machines included in your perimeter are offered for selection. If a machine is missing, contact your administrator to check your access rights.
No data displayed. If the machine has not sent any recent data, the KPI may show an undetermined, grey status. Check the connection status of the associated tablet — see the "Tablet Status" KPI.
The issue duration is not displayed even though the option is ticked. The issue duration is only shown when the machine is actually stopped. While it is running, only the productive duration is visible, if enabled.
Configuring the orange status. The orange threshold is a global setting (General Configuration), not a per-KPI one. Changing it affects every Machine Status KPI in the project.
Deleting a dashboard. Deleting an account (manager or administrator) deletes the dashboards associated with it, including the KPIs they contain.
FAQ
Can I create several Machine Status KPIs for the same machine? Yes. You can for instance create a compact KPI (with no options) for a workshop screen and a detailed one (with the stoppage cause and duration) for a supervision station.
Does the KPI show history? No. The Machine Status KPI is a real-time visual. It shows the instantaneous status of the machine.
Can I share this KPI with other users? The KPI is visible on the dashboard. Any user who has the machine in their perimeter and access to the dashboard will be able to see it.
How often is it updated? The KPI refreshes automatically, in real time, with the data sent by the machine.
What is the difference between "issue duration" and "productive duration"? The issue duration counts the time elapsed since the beginning of the current stoppage. The productive duration counts the time elapsed since the beginning of the current run. The two are mutually exclusive on screen: one is displayed when the machine is stopped, the other when it is running.