Introduction
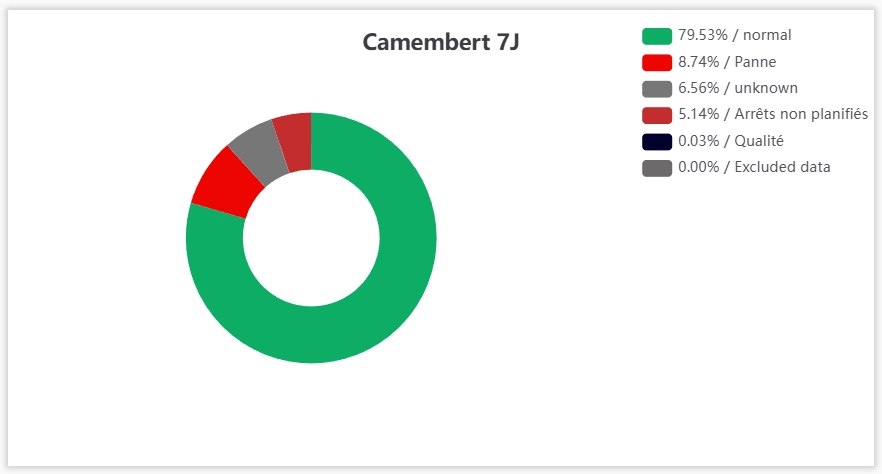
The Pie Chart KPI displays, in real time on your dashboard, how a PERFTRAK machine's time is distributed, as a pie chart. It lets you compare the percentage of losses with the normal production time over a given interval. Each slice corresponds to a loss group — or to the normal operating time — and hovering over it gives you its exact weight.
Example use cases
Overview of a machine's performance — A line manager wants to see at a glance the share of genuinely productive time ("normal") compared with losses. They create a Pie Chart KPI on their machine and immediately identify the dominant loss.
Identifying the main losses — A workshop manager configures the display on the top 5 losses, to focus the analysis on the most penalising stoppage causes without getting lost in marginal ones.
Detailed analysis of a workstation — A methods technician switches to level 2 of the loss tree to get the most granular detail of the causes and prepare a targeted action plan.
Tracking over a given period — A manager sets the interval to the last 7 days to get a consolidated breakdown and compare it from one week to the next.
Creating and configuring a Pie Chart KPI
Step 1 — Create the KPI
Go to your dashboard.
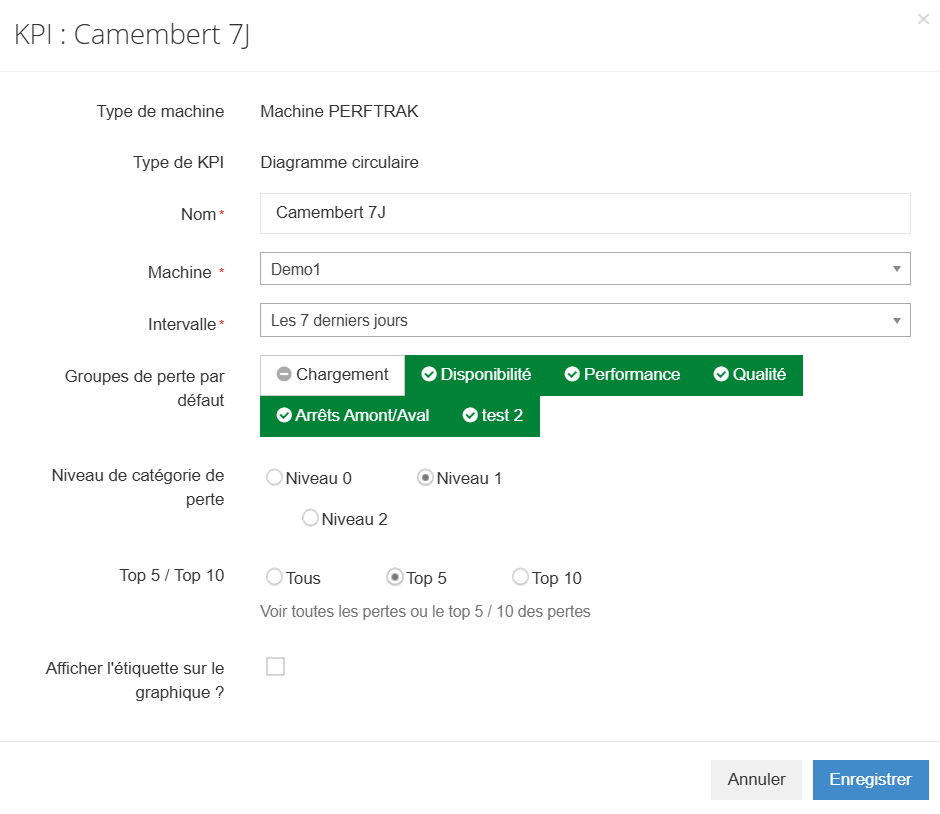
Click Add New KPI, select PERFTRAK machine as the machine type, then Pie Chart as the KPI type.
Step 2 — Enter the name
In the Name field, enter the title of your indicator as it will appear on the dashboard.
Step 3 — Select the machine
In the Machine field, choose the reference machine the indicator will base its calculation on.
Step 4 — Choose the interval
In the Interval field, select the period the breakdown will be calculated over (for example Last hour, Last 7 days).
Step 5 — Select the default loss groups
In Default loss groups, enable the groups you want the chart to show (for example Loading, Availability, Performance, Quality, as well as your custom groups). An enabled group appears in green; click it to enable or disable it.
Step 6 — Choose the loss category level
In Loss category level, select how finely the loss tree is represented:
- Level 0 — the most aggregated view of the losses,
- Level 1 — intermediate level,
- Level 2 — the most detailed view of the causes.
The level chosen determines how finely the slices are broken down in the pie.
Step 7 — Set the display (Top 5 / Top 10)
In Top 5 / Top 10, choose the number of losses represented:
- All — every loss,
- Top 5 — the 5 largest losses,
- Top 10 — the 10 largest losses.
Limiting to the top 5 or top 10 highlights the most significant losses and makes the chart easier to read.
Step 8 — Show the labels or not
Tick Display the label on the chart? if you want the labels to appear directly on the slices. Leave it unticked for a cleaner display — the detail is still available on hover.
Step 9 — Save
Click Save to add the indicator to your dashboard, or Cancel to abandon the creation.
Reading the KPI
The KPI is displayed as a doughnut-style pie chart with a legend. Each slice corresponds to a loss group — or to the "normal" operating time, in green — and the legend details each slice as percentage / label.
Hovering over a slice highlights it, which makes it easier to match with the legend.
Edge cases and points to watch
The loss category level drives the granularity. The same chart looks very summarised at level 0 and much more detailed at level 2. Choose the level according to the analysis you have in mind — overview versus root cause search.
Top 5 / Top 10: the remaining losses are left out of the display. When the chart is limited, the losses outside the top are no longer individually visible. Keep this in mind if you are looking for a specific but infrequent loss.
The quality of the breakdown depends on the loss tree. The groups and loss levels displayed rely on your categorisation. An incomplete loss tree results in an imprecise breakdown.
Indicator on a reference machine. The pie chart is configured for a single machine; it does not consolidate several machines.
FAQ
What does the green "normal" slice represent? It corresponds to the normal operating time of the machine, that is, the productive time excluding losses. The larger this slice, the more the machine ran without losses over the period.
What are levels 0, 1 and 2 for? They determine how finely the loss tree is displayed in the chart: level 0 gives an aggregated view, level 2 the most detailed view of the causes.
Why choose top 5 or top 10 rather than all the losses? To focus on the most significant losses and avoid a chart cluttered with small slices that are hard to interpret.
What is the "Display the label on the chart?" option for? When ticked, it shows the slice labels directly on the chart. When unticked, the chart stays clean and the labels appear on hover.
How do I get the exact percentage of a slice? Each slice is detailed in the legend, as percentage / label. Hovering over a slice also highlights it.
How often is the indicator updated? The chart is recalculated automatically from the losses recorded over the chosen interval.